CARPE DIEM
Professor Mark J. Perry's Blog for Economics and Finance
Sunday, February 28, 2010
When It Comes to His Own Energy Usage/Carbon Footprint, Al "Bigfoot" Gore Uses 19x U.S. Average
"It would be an enormous relief if the recent attacks on the science of global warming actually indicated that we do not face an unimaginable calamity requiring large-scale, preventive measures to protect human civilization as we know it.
Of course, we would still need to deal with the national security risks of our growing dependence on a global oil market dominated by dwindling reserves in the most unstable region of the world, and the economic risks of sending hundreds of billions of dollars a year overseas in return for that oil. And we would still trail China in the race to develop smart grids, fast trains, solar power, wind, geothermal and other renewable sources of energy — the most important sources of new jobs in the 21st century.
But what a burden would be lifted! We would no longer have to worry that our grandchildren would one day look back on us as a criminal generation that had selfishly and blithely ignored clear warnings that their fate was in our hands. We could instead celebrate the naysayers who had doggedly persisted in proving that every major National Academy of Sciences report on climate change had simply made a huge mistake.
I, for one, genuinely wish that the climate crisis were an illusion. But unfortunately, the reality of the danger we are courting has not been changed by the discovery of at least two mistakes in the thousands of pages of careful scientific work over the last 22 years by the Intergovernmental Panel on Climate Change. In fact, the crisis is still growing because we are continuing to dump 90 million tons of global-warming pollution every 24 hours into the atmosphere — as if it were an open sewer."
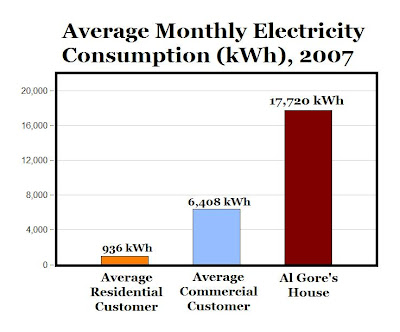
MP: In 2007, Al Gore's mansion in Nashville burned through an average of 17,720 kWh of electricity per month (see Al Gore's energy bills from 2005 to mid-2008 here, via the Tennessee Center for Policy Research, which first reported on Al Gore's energy usage in 2007), which is almost 19 times as much as the monthly electricity consumed by the average U.S. household (936 kWh), and almost 3 times as much electricity as the average U.S. commercial customer (6,408 kWh), see chart above (Dept. of Energy data here). So it's just a little hard to take Al Gore's preaching about climate change too seriously when his own household's contribution to the "climate crisis" is almost 20 times greater of the average American household, and almost three times greater than even the average commercial user of electricity.
So it's classic Al Gore. He talks about a "criminal generation that selfishly and blithely" dumps "global-warming pollution into the atmosphere as if it were an open sewer." However, if personal energy usage was "criminal," Al Gore might be at the top of "America's Most Wanted List," see chart above. Terms that come to mind to describe Al Gore's carbon footprint include "Bigfoot," "Paul Bunyan," "Brobdingnagian," "Sasquatch," or "the elephant in the room." To paraphrase blues pianist Mose Allison, "If polluting was criminal, he'd live a life of crime."
Maybe the article could have been titled, "We Can't Wish Away Climate Change, But We Can Reduce Our Personal Carbon Footprint, But Only If We Really Want To: I'm Not Willing to Change My Lifestyle, But the Rest of You Should."
Voter Unhappiness w/Congress Hits Record Level
Voter unhappiness with Congress has reached the highest level ever recorded by Rasmussen Reports as 71% now say the legislature is doing a poor job (see chart). That’s up ten points from the previous high of 61% reached a month ago. Only 10% of voters say Congress is doing a good or excellent job.
Saturday, February 27, 2010
The Family Physician Cartel Objects to the Expansion of Services Offered By Retail Clinics
"The American Academy of Family Physicians (AAFP) Board of Directors has revised its official policy on retail health clinics to reflect the Academy's opposition to a growing expansion of scope of services provided by many such clinics. In addition, the Academy has discontinued its practice of entering into formal agreements with retail health clinics that support the AAFP's desired attributes.
The AAFP created its retail health clinic policy in 2005 when it became clear that the clinics were increasing in number nationwide. Subsequently, five retail health companies signed agreements with the AAFP to abide by the Academy's desired attributes for such clinics. The four retail health organizations that still hold signed agreements -- MinuteClinic, RediClinic, The Little Clinic and BellinHealth Fast Care -- have been notified that those agreements will be terminated.
In a letter sent to those companies, the Academy said its decision was not intended to reflect negatively on any retail health clinic company. Rather, it was made after observing the evolution of the retail health clinic model into expanded service lines. "The practice of having formal agreements has run its course," says the letter.
When the first few retail health clinics appeared on the health care scene in 2000, the business model featured clinics staffed primarily by nonphysician professionals, such as nurse practitioners. Clinics were designed to treat patients for a limited number of acute illnesses, such as sore throats and ear infections.
Now, nearly a decade later, clinics are operating in 32 states. According to the Convenient Care Association, the number of retail clinics has grown to nearly 1,200 nationwide (MP: And further expansion is projected, see chart above). Notably, two of the nation's largest retail health chains have disclosed to the AAFP their intent to move forward into chronic disease management.
"The AAFP revised its policy because some clinics are expanding their scope of service beyond what the Academy thinks is appropriate," said AAFP President Lori Heim, M.D. The expansion of clinic services most likely reflects the reality that retail clinics need to treat more than walk-in patients with acute health problems to survive economically, she added.
In its revised policy statement, the Academy notes that it does not endorse retail health clinics and believes that the clinics could interfere with the medical home model of care. The AAFP "opposes expansion of their scope of service" and stands against the diagnosis, treatment and management of chronic medical conditions in the retail clinic setting.
Heim commended family physicians who have expanded their office hours and changed their office procedures to allow for same-day appointments to accommodate patients with urgent health care needs. "We need to see more of those kinds of changes, because we know that above all else, patients like the convenience that retail health clinics offer," she said."
MP: Notice in the last paragraph that family physicians have responded to the competition from retail clinics by starting to operate more like retail clinics with expanded hours and same-day appointments. Competition is a great thing for consumers - too bad it seems like the AAFP now wants to limit it.
Is the Dismal Science Really a Science? Is There Really Such a Thing as Free Beer?
Russ Roberts writing in the Wall Street Journal:
"The defenders of modern macroeconomics argue that if we just study the economy long enough, we'll soon be able to model it accurately and design better policy. Soon. That reminds me of the permanent sign in the bar: Free Beer Tomorrow.
We should face the evidence that we are no better today at predicting tomorrow than we were yesterday. Eighty years after the Great Depression we still argue about what caused it and why it ended.
If economics is a science, it is more like biology than physics. Biologists try to understand the relationships in a complex system. That's hard enough. But they can't tell you what will happen with any precision to the population of a particular species of frog if rainfall goes up this year in a particular rain forest. They might not even be able to count the number of frogs right now with any exactness.
We have the same problems in economics. The economy is a complex system, our data are imperfect and our models inevitably fail to account for all the interactions.
The bottom line is that we should expect less of economists. Economics is a powerful tool, a lens for organizing one's thinking about the complexity of the world around us. That should be enough. We should be honest about what we know, what we don't know and what we may never know. Admitting that publicly is the first step toward respectability."
MP: TANSTAFBeer.
Rising Wages in China = Re-Valuing China's Currency
NEW YORK TIMES -- "Just a year after laying off millions of factory workers, China is facing an increasingly acute labor shortage. As American workers struggle with near double-digit unemployment, unskilled factory workers here in China’s industrial heartland are being offered signing bonuses. Factory wages have risen as much as 20 percent in recent months (see chart).
Some manufacturers, already weeks behind schedule because they can’t find enough workers, are closing down production lines and considering raising prices. Such increases would most likely drive up the prices American consumers pay for all sorts of Chinese-made goods. Rising wages could also lead to greater inflation in China.
Reasons for the labor shortage?
For one, the Chinese government has rapidly expanded postsecondary education. Universities and other institutions of higher learning enrolled 6.4 million new students last year, compared to 5.7 million in 2007 and just 2.2 million in 2000. At the same time, China’s birth rate has been sliding steadily ever since the introduction of the “one child” policy in 1977. Labor shortages have returned quickly in recent weeks as these long-term trends have collided with a recovery in overseas demand for Chinese goods.
Consumer spending is also rising briskly; auto sales more than doubled last month from a year before, and this has created many jobs in retailing, restaurants, hotels and other inland businesses.
Though the wage boost increases the prospect of inflation, it may have another more salutary aspect. The Obama administration has been pushing China to let the renminbi rise against the dollar, which would erode some of China’s formidable advantage in export markets. Rising wages in China have the same effect — while also giving Chinese families more spending power."
HT: Lyle Meier
Wall Street's Obsession with Curling: "Horseshoes Combined with Housekeeping;" "Chess on Ice"
From the NY Times -- "On Wall Street, a Romance With Curling":
"It never would’ve happened without CNBC — or, in all likelihood, at any other time of year.
This slow-poke game, which originated in 16th-century Scotland, has captivated the Type-A world of Wall Street almost by accident. CNBC, whose market chatter is the background music on trading floors, switches to curling from Vancouver shortly after the closing bell."
Friday, February 26, 2010
Another Trade Re-write: U.S. Consumers, American Companies Slammed With New Steel Taxes
Business Insider: "
One has to
From China Daily:
"The United States government on Wednesday imposed preliminary
The decision puts further strain on US-China trade relations, already tested by disputes over other US trade actions and China's currency policy.
It is a victory for US Steel Corp and the United Steelworkers union, which filed a petition in October asking for protection against the more efficiently produced and lower-priced Chinese imports, but a huge loss for American companies that purchase steel and U.S. consumers who purchase products made from steel."
See previous trade re-write examples here and here.
Jan. Home Sales Drop Sharply from Dec., But Are At Highest Level for Month of January Since 2007
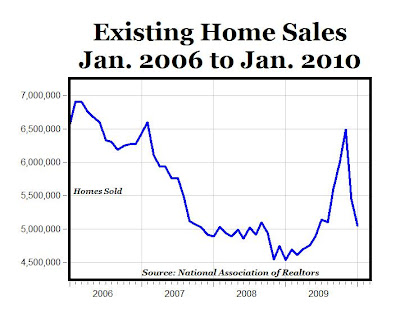
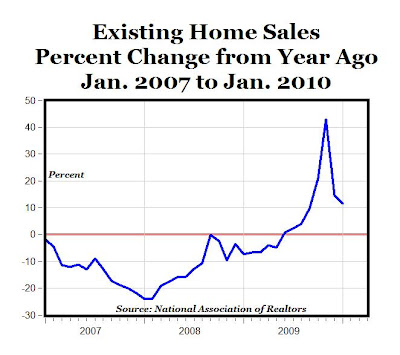
 "Existing-home sales fell in January but are above year-ago levels, according to the National Association of Realtors. Existing-home sales – including single-family, townhomes, condominiums and co-ops – dropped 7.2% to a seasonally adjusted annual rate of 5.05 million units in January from a revised 5.44 million in December, but remain 11.5% above the 4.53 million-unit level in January 2009 (see top two charts above).
Lawrence Yun, NAR chief economist, said there is still some delay between shopping and closing that affected current sales. “Most of the completed deals in January were based on contracts in November and December. People who got into the market after the home buyer tax credit was extended in November have only recently started to offer contracts, so it will take a couple months to close those sales,” he said. “Still, the latest monthly sales decline is not encouraging, and raises concern about the strength of a recovery.”
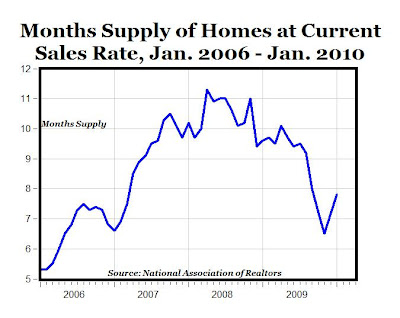
Total housing inventory at the end of January fell 0.5% to 3.27 million existing homes available for sale, which represents a 7.8-month supply at the current sales pace, up from a 7.2-month supply in December, but down from a 9.6-month supply in January 2009 (see bottom chart above)."
Other reports for January real estate sales:
1. Sales of existing homes and condos in South Florida rose in January, though prices continued to fall. Statewide, existing home sales were up 28% last month, to 10,465 homes sold from 8,174 homes sold a year ago, according to Florida Realtors. Existing condo sales rose 81% statewide compared to the previous year's sales figure. This marks the 17th consecutive month that Florida sales activity has increased in a year-to-year comparison.
2. Reflecting a trend seen across much of the West, Phoenix region January home sales fell harder than normal from December, but they were still the highest for a January since 2007.
There were continued signs of price stability for resale houses. The median price paid for existing single-family detached houses didn’t decline from the year-ago level for the first time since July 2007, though it slipped a bit from December.
3. Las Vegas region January home sales fell more than usual from December but were still the highest for that month since 2007 thanks to relatively strong demand for condos and other sub-$200,000 homes. The overall median sale price declined from December, but one home-type category – resale single-family detached houses – showed continued signs of price stability.
MP: Many reports are expressing concern about the strength of the real estate recovery because of the huge drop from December sales, but year-to-year January sales increased at 11.5%, and are at the highest level for that month in three years both nationally and in markets like Phoenix and Las Vegas.
January Trucking Jumps By Highest Rate in 4 Years
 ARLINGTON, VA — The American Trucking Associations’ advance seasonally adjusted (SA) For-Hire Truck Tonnage Index jumped 3.1% in January, following a revised 1.3% increase in December 2009. The latest gain boosted the SA index from 107 (2000=100) in December to 110.4 in January, its highest level since September 2008.
Compared with January 2009, SA tonnage surged 5.7%, which was the best year-over-year reading since January 2005 and the second consecutive increase. For all of 2009, the tonnage index was down 8.7% (slightly larger than the previously reported 8.3 percent drop), which was the largest annual decrease since a 12.3% plunge in 1982.
ATA Chief Economist Bob Costello said that the latest tonnage reading, coupled with anecdotal reports from carriers, indicates that both the industry and the economy are clearly in a recovery mode. “While I don’t expect tonnage to continue growing as robustly as it did in January, the industry is finally moving in the right direction. Although there are still risks that could throw the rebound off track, the likelihood of that happening continues to diminish.”
Game-Changer: Oil Industry Booms in North Dakota
WALL STREET JOURNAL — "A massive oil reserve buried two miles underground has put North Dakota at the center of a revolution in the U.S. oil industry, a shift that has radically altered the fortunes of this remote area. The Bakken Shale deposit has been known and even tapped on occasion for decades. But technological improvements in the past two years have taken what was once a small, marginally profitable field and turned it into one of the fastest-growing oil-producing areas in the U.S.
The Bakken Shale had helped North Dakota oil production double in the past three years, surging to 80 million barrels in 2009—tiny relative to the more than seven billion barrels consumed by the U.S. every year, but enough to vault the state past Oklahoma and Louisiana to become the country's fourth-biggest oil producer, after Texas, Alaska and California. If current projections hold, North Dakota's oil production could pass Alaska's by the end of the decade.
The Bakken Shale could contain up to 4.3 billion barrels of recoverable oil, according to the U.S. Geological Survey. That would make it the biggest oil field discovered in the contiguous U.S. in more than 40 years—and many in the industry believe the amount of recoverable oil could be even greater as new technology allows companies to tap more of it.
Oil companies have known about the formation, and the oil trapped in it, since at least the 1950s. But they couldn't get more than a trickle of oil from the dense, nonporous rock.
That began to change in the early 2000s, when companies in Texas began using new drilling techniques in a similar formation near Fort Worth known as the Barnett Shale. They would drill down thousands of feet and then turn and go horizontally through the gas-bearing rock—allowing a single well to reach more gas. Then they would blast huge volumes of water down the well to crack open the rocks and free the gas trapped inside.
The real shift has come in the past two years as companies honed drilling techniques, leading to bigger wells, faster drilling and lower costs. Marathon, for example, last year took an average of 24 days to drill a well, down from 56 days in 2006."
MP: Just like how advanced drilling techniques have led to a revolution in the domestic natural gas industry, new technologies for drilling oil have revolutionized the domestic oil industry. That's one reason that peak oil is peak idiocy: it always underestimates the ultimate resource - human capital (i.e. human ingenuity and the resulting innovation, advances, new technology) - which is endless and boundless, and will never peak.
Bank Failures: 12,000 in the U.S. vs. 2 in Canada
Number of bank failures during the 1930s
United States: 9,000
Canada: 0
Number of Bank Failures during S&L crisis (1980s-90s)
United States: Almost 3,000
Canada: 2
Number of Bank Failures during the Great Recession (2007-2010)
United States: 196
Canada: 0
Delinquency Rate for Home Mortgages in December 2009
United States: 9.47%
Canada: 0.45%
Return on Equity for the Banking Industry in 2008
United States: -15% (approx.)
Canada: +10% (approx.)
Home Ownership Rate
United States: 67.2%
Canada: 69%
What explains these significant differences between the U.S. and Canada? What is it about the Canadian banking system that allowed it to survive the recent worldwide slowdown without a single bank failure? What can the United States learn from Canada about sound banking? Find out here at my America.com article "Due North: Canada’s Marvelous Mortgage and Banking System."
Thursday, February 25, 2010
International Air Traffic Improves at Year-end
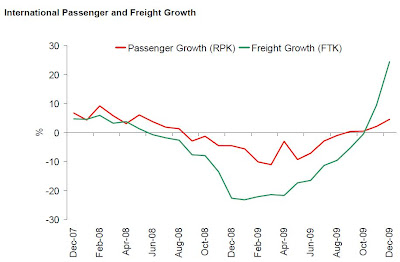
"The International Air Transport Association (IATA) reported December and full-year 2009 demand statistics for international scheduled air traffic that showed the industry ending 2009 with the largest ever post-war decline. Passenger demand for the full year was down 3.5% with an average load factor of 75.6%. Freight showed a full-year decline of 10.1% with an average load factor of 49.1%."
But there were some encouraging year-end improvements:
1. "December 2009 passenger demand recorded a 4.5% improvement compared to December 2008 (see chart above), with a load factor of 77.6%. While this is an 8.4% demand improvement from the February 2009 low point, it is still 3.4% below the early 2008 peak.
2. December 2009 freight demand showed a 24.4% improvement on December 2008 (see chart) with a load factor of 54.1%. This improvement is exaggerated by the exceptionally weak performance in December 2008 which was the low point on the cycle. Freight demand is still 9% lower than the peak in early 2008. Optimism is returning to the industry as purchasing managers survey indicators reached a 44-month high in December pointing towards increased freight volumes in the coming months."
"The Cartel" Documentary: Education + Politics = $
A feature-length documentary about our urgent national need for school choice, "The Cartel" shows us our failing educational system like we've never seen it before.
In this hard-hitting film by reporter and news anchor Bob Bowdon, "The Cartel" exposes the corruption, waste, and intimidation in our nation's public schools. Arguing that our public school system wastes billions of dollars each year, while our children learn less and less, "The Cartel" makes a compelling case for far-reaching and immediate reform centered on school choice.
Upcoming: "The Cartel" Premieres in 11 Major Cities in April 2010.
Twitter Venn Diagrams

At the Twitter Venn website, you enter two or three search terms and then view a Venn diagram showing the tweet frequency per day of each term separately, and the frequency of overlap between and among the terms. As a bonus, you also get a small word map of the most common terms related to each search term; tweets per day for each term by itself and each combination of terms; and a recent tweet.
The example above shows the Venn diagram result for tweets containing the names President Obama, Tiger Woods and Paris Hilton. Notice the ranking: Tiger Woods (10,553 per day), President Obama (8,407 per day) and Paris Hilton (4,290 per day), and also note that there are fewer than 10 tweets per day with: a) both Presdient Obama and Tiger Woods and b) both Tiger Woods and Paris Hilton; and no tweets with President Obama and Paris Hilton.
From the Harvard Business Review blog post "Four Ways of Looking at Twitter."
Let's Call the Whole Thing Off

"To bring down healthcare costs, we need to change the incentives that govern spending. Right now, $5 out of every $6 of health-care spending is paid for by someone other than the person receiving care—insurance companies, employers, or the government. Individuals are insulated from the reality of what their decisions cost. This breeds overutilization of low-value health care and runaway spending.
To reduce the growth of costs, individuals must take greater responsibility for their health care, and health insurers and health-care providers must face the competitive forces of the market. Three policy changes will go a long way to achieving these objectives: 1) eliminate the tax code's bias that favors health insurance over out-of-pocket spending; 2) remove state-government barriers to purchasing and providing health services; and 3) reform medical malpractice laws.
These three policies offer advantages over the president's plan. Instead of raising health-care costs, they fundamentally change incentives among individuals, insurers, and providers to gradually slow the growth in costs by reducing inefficient demand without sacrificing quality and innovation. Instead of radically changing health care overnight, they take an incremental approach, respecting the tremendous uncertainty surrounding the effectiveness of different approaches to rein in costs.
The president's plan is failing because it does not speak to the concerns of the majority of Americans. Instead of addressing the high and rising costs of care, it proposes mandates, invasive regulation, and unaffordable new entitlements. This will not bring health-care costs down—it will only make this problem worse.
Our recommendation: scrap it and start over."
MP: The chart above shows the declining share of out-of-pocket payments for total health care spending, according to the Department of Health and Human Services, and it's even worse than the $5 out of $6 the authors report in the WSJ. It's actually closer to $8 out of every $9 of healthcare spending that is paid by someone other than the person receiving care, i.e. with OPM (other people's money), since out-of-pocket payments covered only 11.88% of total health care spending in 2008.
Growth in Durable Goods Hits 3-Yr. High of 10.2%
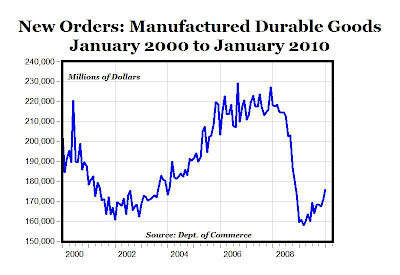

MP: New orders for durable goods in January reached the highest level ($175.7 billion) since November 2008 (see top chart above). The 12-month percentage change in January of 10.2% was the highest annual increase in new orders for durable goods and equipment from U.S. manufacturers since September 2006, more than three years ago, and also marked the 7th consecutive monthly improvement for new orders (see bottom chart above). Add this to the growing list of V-shaped signs of economic recovery, especially in the manufacturing sector.
Canada: You Can Buy MRIs for Dogs, Not People
"Canada is the only country other than Cuba and North Korea to ban private health insurance and private medical care. The prohibition is viewed as bizarre in other nations with universal health care. Sweden has long allowed private insurance for elective services. In Australia, private hospitals provide a third of the nation's capacity. In Germany and the Netherlands, anyone above a certain income threshold is allowed to leave the public system.
In Canada, the ban on private insurance results in truly loopy law. Dr. Sheldon Elman, the personal physician for Liberal Prime Minister Paul Martin, says the system is "disastrously terrible" in key areas. "You can buy an MRI for your dog and you cannot buy it for your daughter," he told the Montreal Gazette."
~John Fund in the Wall Street Journal
Wednesday, February 24, 2010
Quote of the Day: Government Beer?
"The latest gambit to increase government control of your life comes under the guise that private health insurance companies have been making "excessive" profits, taking advantage of their privileged economic positions. Acting like a shill for the administration, "Health Care for America Now" writes, "Simply put, the private insurance companies have secured monopolies or tight oligopolies and exercised that power to put profits ahead of patients."
What might have established the so-called monopoly and oligopoly? Why, government, of course. New York State has an impressive government regulatory structure that specifies what must be covered by your insurance policy. By law, you are restricted from shopping elsewhere for coverage. Your premiums reflect unfunded mandates dictated by the state legislature and Congress. It makes no sense to increase the power of government to restrict competition further if it is competition that helps hold down profits.
By the way, just how obscene are those profits? Economist Mark J. Perry, at the Carpe Diem blog listing of Profit Margins by Industry, shows the Health Care Plan Industry ranks #86 by profit margin (profits/revenue) at 3.3 percent and the hospital industry ranks #77 at 3.6 percent — much lower than the 25.6 percent profit margin for beer brewers. Yet the administration is not beating the drums to hold down brewery profits or to take over the industry to create Government Beer."
~Rome (N.Y.) Sentinel editorial
Real Estate Rebound in Canada: Home Price Index Rises for 8th Straight Month to a New Record High
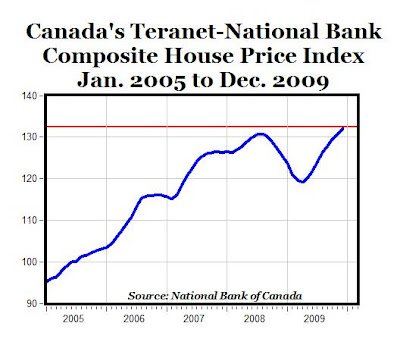
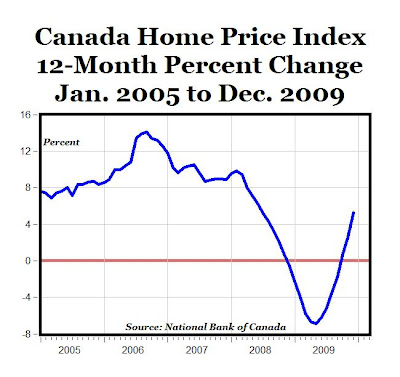 1. "Canadian home prices in December were up 5.2% from a year earlier, double the 12-month advance recorded in November, according to the Teranet-National Bank National Composite House Price Index. December was the third consecutive month in which prices were up from a year earlier, after 10 consecutive months of 12-month deflation. The turnaround is due to eight straight monthly increases in the countrywide index. December's robust 1.2% monthly gain pushed the composite index above the pre-recession peak, that is, to a new record (see chart above)."
2. REUTERS -- "Encouraged by rock-bottom interest rates and rising consumer confidence, home sales and prices have been on a stunning rebound after grinding almost to a halt in the wake of the global financial crisis in late 2008.
"All in all, this report adds to the growing list of indicators pointing to a strong housing market in Canada, and underscores the view that Canadian home buyers are continuing to take advantage of the still favorable buying conditions, particularly given the very low mortgage rates (variable-rate mortgages goes are just 2.25% and five-year fixed-rate mortgages are below 4%)," said Millan Mulraine, an economics strategist at TD Securities."
3. Does Canada now have to be worried about a U.S.-style housing bubble? Opinions are mixed, but some experts are saying Yes, see article here.
College Degrees By Gender
 The table above shows the share of colleges degrees (Bachelor's, Master's and Doctor's) by gender for the 2006-2007 academic year (data here). Women earned a majority of both Bachelor's and Master's degree, and outnumbered men in nine out of 17 academic areas by a wide margin, the lowest share being 60.2% of all degrees in biology to a high of 86% of all degrees in health professions. Men outnumbered women in six fields (agriculture, architecture, business, math, physical sciences and social sciences) by a fairly narrow margin, with shares ranging between 50.8% of business degrees and 59.1% of degrees in the physical sciences. In two other subject areas (computer science and engineering), men earned more than 80% of the degrees.
For total doctoral degrees, the shares for women (49.1%) and men (50.9%) are almost equal, and women earn more than 50% of the degrees in 8 fields; men more than 50% of the degrees in 9 fields. Also, for the undergraduate subject areas that women dominate (biology, communication, education, English, foreign languages, health professions, psychology, and public administration) they also tend to dominate for Master's degrees, with just a slight drop in their share of degrees by only about a percent in some fields (biology, education, English). In some cases the female share of degrees actually increases at the Master's level (communication, foreign languages, and psychology). However, at the doctoral level, the female share of degrees tends to drop by between 5 and 10 percentage points compared to their share of Master's degrees for the same field.
Given the fact that men (mean = 534 points in 2009) continue to score higher on the SAT math test by about 35 points compared to women (mean = 499 points), the overrepresentation of men earning undergraduate degrees in computer science and engineering might not be too surprising. And the fact that women score about 13 points higher on the SAT writing test compared to men (499 vs. 486 for mean scores), the overrepresentation of women in fields like English, communication, and foreign languages might not be too surprising. And probably what would be most surprising would be perfect gender equity in each academic field, although that seems to be the desired outcome for some.
Too Many Apologies?
Thomas Sowell: "Tiger Woods doesn't owe me an apology. Nothing that he has ever done has cost me a dime nor an hour of sleep. Public apologies to people who are not owed any apology have become one of the many signs of the mushy thinking of our times.
So are apologies for things that somebody else did. When somebody who has never owned a slave apologizes for slavery to somebody who has never been a slave, then what began as mushy thinking has degenerated into theatrical absurdity-- or, worse yet, politics."
Warren Meyer: "I saw some news story that Tiger Woods was going to publicly apologize. Why? What did he do to me? I suppose he could apologize to us for letting us down by under-performing his public image, but he has taken a $100 million a year hit for the damage he did to his own image. I am willing to call things square between us."
Tuesday, February 23, 2010
Quote of the Day: "My Heart, My Choice"
"I did not sign away my right to get the best possible health care for myself when I entered politics."
~Canadian Premier of Newfoundland and Labrador Danny Williams
HT: John Goodman
NY Fed Treasury Spread Model: Probability of Recession Falls to Lowest Level Since 1983
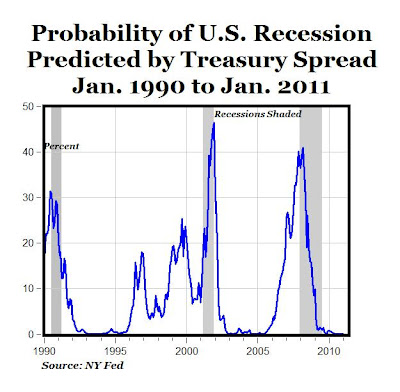
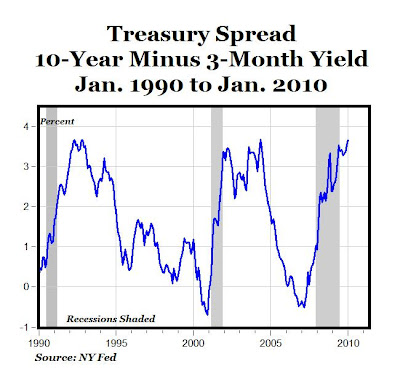 Today the New York Federal Reserve updated its "Probability of U.S. Recession Predicted by Treasury Spread" with data through January 2010, and the Fed's recession probability forecast through January 2011 (see top chart above). The NY Fed's model uses the spread between 10-year and 3-month Treasury rates (3.67% spread in January, the highest since May 2004) to calculate the probability of a recession in the U.S. twelve months ahead (see details here).
The Fed's model (data here) shows that the recession probability peaked during the October 2007 to April 2008 period at around 35-40%, and has been declining since then in almost every month. For January 2010, the recession probability is only 0.82% (less than 1%) and by a year from now in January 2011 the recession probability is only .043%, the lowest reading in more than 26 years (since September 1983).
Further, the Treasury spread has been above 3% for the last nine months (since May), a pattern consistent with the economic recoveries following the last two recessions (see bottom chart above), and the 3.67% spread in December is the highest since May 2004, five-and-a-half years ago. Finally, the pattern of the recession probability index last year (going below double-digits and declining monthly) is very similar to the patterns that signalled the end of the 1990-1991 and 2001 recessions.
According to the NY Fed model, the chances of a double-dip recession in 2010 or 2011? Zero.
Case-Shiller Home Index Improves for 12th Month
 "In December, the 10-City and 20-City S&P/Case-Shiller Home Price Indices recorded annual declines of 2.4% and 3.1%, respectively. These two indices, which are reported at a monthly frequency, have seen improvements in their annual rates of return every month since the beginning of the year (see chart above)."
Women Earn Almost 50% of College Math Degrees
 We hear a lot about how women are underrepresented in STEM (science, technology, engineering and mathematics) fields and careers, and "Nationwide, there is a push for more women to choose STEM fields." There is a special National Science Foundation program called ADVANCE, whose goal is to:
"Increase the representation and advancement of women in academic science and engineering careers, thereby contributing to the development of a more diverse science and engineering workforce. ADVANCE encourages institutions of higher education and the broader science, technology, engineering and mathematics (STEM) community, including professional societies and other STEM-related not-for-profit organizations, to address various aspects of STEM academic culture and institutional structure that may differentially affect women faculty and academic administrators. As such, ADVANCE is an integral part of the NSF’s multifaceted strategy to broaden participation in the STEM workforce, and supports the critical role of the Foundation in advancing the status of women in academic science and engineering."
Although it did not specifically address the STEM issue, an editorial in Sunday's Washington Post talked about the "epidemic of sexism" in the U.S., and how "for women in America, equality is still an illusion."
What makes these results even more interesting is that men on average score about 35 points higher on the math portion of the SAT exam than women, so we might expect men to be much more overrepresented than the data for math degrees show. There are many sex imbalances for college degrees by academic field, and most of them favor women, as does the overall college degree imbalance. The fact that women earned more than 44% of all bachelor's degrees in math, and more than 41% of all master's degrees in math in 2006, suggests that there is no "epidemic of sexism" in college math departments, and equality in higher education is more than an illusion.
Quote of the Day
"Take Wall Street "greed." Is there any evidence that people on Wall Street were any less interested in making money during all the decades and generations when investments in housing were among the safest investments around? If their greed did not bring on an economic disaster before, why would it bring it on now? As for lenders, how could they have expected to satisfy their greed by lending to people who were not likely to repay them?"
~Thomas Sowell
Monday, February 22, 2010
3X Inc. in Charge-Off Rate for Credit Cards Since '06 to Record High; Don't Issuers Deserve Protection?
 The Credit Card Act of 2009 provides a lot of protection for cardholders:
Cardholders Deserve Protections against Arbitrary Interest Rate Increases
Cardholders Should Be Protected from Due Date Gimmicks
Cardholders Who Pay on Time Should Not Be Penalized
Cardholders Should Be Protected from Misleading Terms
Cardholders Deserve the Right to Set Limits on Their Credit
Card Companies Should Fairly Credit and Allocate Payments
Card Companies Should Not Impose Excessive Fees on Cardholders
Vulnerable Consumers Should Be Protected From Fee-Heavy Subprime Credit Cards
But given the fact that the charge-off rates for credit card loans (data here) have more than tripled from about 3% in early 2006 to 10.24% in the third quarter of 2009 to a record high 10.24% (see graph above), don't the banks and credit card issuers deserve some protection against reckless, irresponsible cardholders and record-high delinquencies, defaults and charge-off rates?
Distortionary Effects of Regulations and the Law of Unintended Consequences: Annual Fees Are Back
WASH POST -- "A law hailed as the most sweeping piece of consumer legislation in decades has helped make it more difficult for millions of Americans to get credit, and made that credit more expensive.
It wasn't supposed to be this way. The law that President Barack Obama signed last May shields card users from sudden interest rate hikes, excessive fees and other gimmicks that card companies have used to drive up profits. Consumers will save at least $10 billion a year from curbs on interest rate increases alone, according to the Pew Charitable Trust, which tracks credit card issues.
But there was a catch. Card companies had nine months to prepare while certain rules were clarified by the Federal Reserve. They used that time to take actions that ended up hurting the same customers who were supposed to be helped."
Exhibit A: "Annual fees, common until about 10 years ago, have made a comeback. During the final three months of last year, 43% of new offers for credit cards contained annual fees, versus 25% in the same period a year earlier, according to Mintel International, which tracks marketing data. Several banks also added these fees to existing accounts. One example: Many Citigroup customers will start paying a $60 annual fee on April 1."
MP: This story clearly illustrates the Law of Unintended Consequences ("Any intervention in a complex system may or may not have the intended result, but will inevitably create unanticipated and often undesirable outcomes.") and why regulations are distortionary - because companies can change their behavior to avoid or circumvent them.
Other examples include free food on airlines to circumvent ticket price-fixing by the government in the old days, employer-sponsored health insurance to circumvent price/wage controls during WWII, free "stuff" (toasters, etc.) at banks in the 1960s and 1970s to avoid interest rate controls on savings accounts, charging points on a mortgage to circumvent interest rate maximums on mortgage loans, or in this current case a resurrection of annual fees, etc.
HT: Lee Coppock
Update: Reason article on this topic (thanks to Colin).
Another V-Sign of Economic Recovery: Chicago Fed National Activity Index Reaches 30-Month High
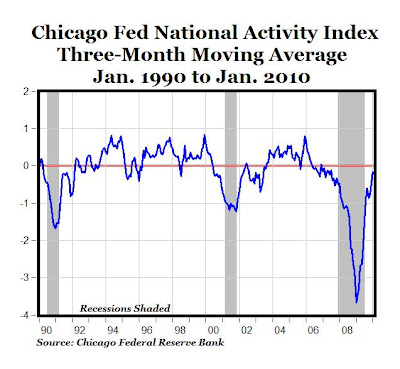 "Led by improvements in production- and employment-related indicators, the Chicago Fed National Activity Index in January was slightly positive for the second time in the past three months. From June 2007 through October 2009, the index had been consistently negative. The index increased to +0.02 in January from –0.58 in December, with all four categories of indicators having improved.
The index’s three-month moving average, CFNAI-MA3, increased to –0.16 in January from –0.47 in December, reaching its highest level since July 2007 (see chart above). January’s CFNAI-MA3 suggests that, consistent with the early stages of a recovery following a recession, growth in national economic activity is beginning to near its historical trend."
Sunday, February 21, 2010
More on Public School Spending: D.C. vs. U.S.A.
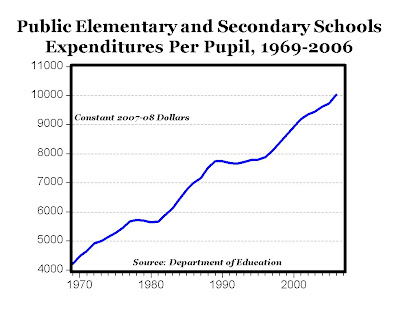 Nationally, inflation-adjusted public school spending per pupil has more than doubled since the late 1960s (see graph above, data here).
Since the late 1950s, real spending per pupil in D.C. has grown much faster than the national average, having increased by 6.6 times while the national average increased only four times (see chart below, data here).
More on D.C. Public School Spending
 There's been a lively discussion about this CD post on D.C. public school spending. Whether the per pupil public spending in D.C. is $15,000 or $25,000, and whether certain capital expenditures should be included or not, probably aren't as important as some of the bigger issues that should get more attention than the minor details (although I also provide clarification of the details below):
1. The growth in public school spending at the national level has been staggering. According to the Department of Education (data here), "Total expenditures per pupil in public elementary and secondary schools" increased 234 times between 1919 ($48) and 2006 ($11,257), and current expenditures per pupil has increased 245 times ($40 to $9,683). Over that same period, the CPI (All Items, data here) increased only about 12 times (see graph above).
Back to the details:
2. According to data from the Department of Education (data here, Table 186) for "Current expenditure per pupil in average daily attendance in public elementary and secondary schools," spending per pupil in the D.C. schools was $20,596 in 2006-2007 (measured in constant 2007-2008 dollars), and that was the highest amount in the country and almost twice the national average of $10,720. Whether spending was $20,000 or $25,000 isn't as important as the fact that D.C. public school spending leads the country, when everything is calculated on a consistent basis.
3. From the same table, real spending per D.C. pupil in 1959 was only 15% above the national average and by 2006-2007 D.C. spending was 92% above the national average. Over the last fifty years, real spending per student in D.C. has increased by 6.63 times (from $3,106 to $20,596) since 1959, and that increase is the highest in the country, and compares to an average real increase in spending of 4.37 times between 1959 and 2006.
4. Department of Education data (Table 178) for "Total Expenditures for public elementary and secondary education" shows that the D.C. public schools spent $1,389,995,000 (almost $1.4 billion) for the 2006-2007 school year, which is even higher than the $1.29 billion reported in my last post (based on Andrew Coulson's data).
5. Department of Education data also show that the D.C. schools have one of the lowest high school graduation rates of 65.4% for 2005-2006, a full eight percentage points below the national average of 73.4%.
Bottom Line: The important issues to me should be: a) the significant increase in real spending over time for public schools in general, b) the fact that D.C. public schools spend more than $1 billion per year and lead the country in per pupil spending, c) D.C. schools have had the greatest spending increases over the last 50 years, d) D.C. schools have one of the lowest graduation rates in the country, and e) the resistance by teachers' unions, Democrats (usually) and labor unions to school choice in D.C. and around the country, like the Opportunity Scholarship Program in D.C.
Saturday, February 20, 2010
Julian Simon: More Right Than Lucky
 Paul Kedrosky re-visits the famous Simon-Erlich bet. Alex Tabarrok responds here. Paul wrote:
"It will surprise no-one that the bet’s payoff was highly dependent on its start date. Simon famously offered to bet comers on any timeline longer than a year, and on any commodity, but the bet itself was over a decade, from 1980-1990. If you started the bet any year during the 1980s Simon won eight of the ten decadal start years. During the 1990s things changed, however, with Simon the decadal winners in four start years and Ehrlich winning six – 60% of the time. And if we extend the bet into the current decade, taking Simon at his word that he was happy to bet on any period from a year on up, then Ehrlich won every start-year bet in the 2000s. He looks like he’ll be a perfect Simon/Ehrlich ten-for-ten."
MP: It should also surprise no one that a commodity bet's payoff is not only highly dependent on the starting and ending dates, but also on the specific commodities chosen. In the famous bet, Ehrlich chose the five commodities that he thought would become scarcer, but a more complete analysis of commodity scarcity and prices over time shouldn't be restricted to only those five commodities, and the time periods evaluated shouldn't be restricted to just decades.
The chart above shows the monthly, inflation-adjusted Dow Jones-AIG Commodity Index back to January of 1934 (data from Global Financial Data, paid subscription required, adjusted for inflation using BLS data). The DJ-AIG index is composed of futures contracts on 19 physical commodities (e.g. natural gas, live cattle, zinc, nickel, copper, silver, cotton, etc., see the full list and current weights here). (Note: According to Global Financial Data, data in the index from 1933 to 1989 are from the Dow Jones Futures Index, and data from 1990 are from the Dow Jones-AIG Commodity Index.)
The red line in the graph shows the statistically significant (p = .0000) downward trend in inflation-adjusted commodity prices since the 1930s.
Paul Kedrosky: So, what does all this mean? A few things. First, and most importantly, it means Simon was right but fairly lucky. There is nothing wrong with being lucky, of course, but compulsive Simon/Ehrlich-citers need to be reminded that it is no law of nature (let alone of rickety old economics) that commodity prices (inflation-adjusted or otherwise) trend inexorably downward, even over a decade.
MP: I'm not so sure that Simon was just lucky. If Simon's position was that natural resources and commodities become generally more abundant over long periods time, reflected in falling real prices, I think he was more right than lucky, as the graph above demonstrates.
Stated differently, if Simon was really betting that inflation-adjusted prices of a basket of commodity prices have a significantly negative slope over long periods of time, and Ehrlich was betting that the slope of that line was significantly positive, I think Simon wins the bet.
Update: By request, data available here.
DC Public Schools: $1.29 Billion, $28,170 per Pupil

 The Cato Institutes's Andrew Coulson had crunched the numbers and finds that the District of Columbia public school system spent almost $1.3 billion educating 45,858 students for the 2008-2009 school year (data here).
 Median CPI Inflation Falls 16th Month: Record Low
 According to a report released Friday by the Federal Reserve Bank of Cleveland, the median Consumer Price Index was virtually unchanged at 0.0% (0.5% annualized rate) in January. The "median CPI" is a measure of core inflation calculated by the Federal Reserve Bank of Cleveland based on data in the monthly CPI report from the Bureau of Labor Statistics' (BLS).
Earlier Friday, the BLS reported that the seasonally adjusted CPI for all urban consumers was increased 0.2% (1.6% annualized rate) in January. The CPI less food and energy decreased 0.1% in January. Over the last 12 months, median CPI inflation was 1.0% compared to CPI inflation of 2.6% (see chart above).
According to the Cleveland Fed:
"Federal Reserve policymakers are always on the lookout for inflation (i.e., a general increase in prices), and they use a variety of measures to gauge inflation trends. One such measure is the Consumer Price Index (CPI) published by the BLS.
The CPI measures changes in the prices of a number of goods and services—things like gas, rent, groceries, and clothing. However, the prices of some of these items—such as food and energy—are volatile; they can change a lot from month to month, based on supply and demand. So the BLS also publishes a measure of “core” prices that excludes food and energy prices. Researchers at the Federal Reserve Bank of Cleveland and Ohio State University devised a different way to get a “core CPI” measure—or a measure of underlying inflation trends. It’s called the Median CPI.
To calculate the median CPI, the Federal Reserve Bank of Cleveland looks at the prices of the goods and services published by the BLS. But instead of calculating a weighted average of all of the prices, as the BLS does, the Cleveland Fed looks at the median price change—or the price change that’s right in the middle of the long list of all of the price changes. According to research from the Cleveland Fed, the median CPI provides a better signal of the inflation trend than either the all-items CPI or the CPI excluding food and energy." (emphasis added)
MP: Historically, the median CPI has been 50% more accurate at gauging future inflation than the traditional CPI (based on the Cleveland Fed's research), and the median CPI is certainly not now showing any signs of inflationary pressures.
In fact, the decrease in January's median CPI to 1.0% from 1.20% in December was the 16th consecutive monthly drop in median CPI inflation, and the lowest year-to-year inflation rate in the history of the Cleveland Fed's series back to 1984 (historical data here). Therefore, as I reported a month ago, it would seem that a stronger case could be made right now for deflation, than making a case for inflation.


