Monday, November 30, 2009

Interesting Lists

1. America's Best Bang-For-The-Buck Cities: Omaha, Little Rock, Jackson, Des Moines, Augusta.

2. Top Words, Phrases and Names for 2009: a) Twitter, H1NI, Obama; b) King of Pop, Obama-mania, Climate Change; c) Barack Obama, Michael Jackson, Mobama. For previous years, go here.

When It Rains in Cuba: Leaky Roofs, No Umbrellas

One might think that in a tropical country life is organized taking the climate into account, and that along with our light clothing we always have umbrellas and raincoats at hand. Not so. Leaking roofs are common, especially in the construction of the last fifty years; homes, offices, schools and hospitals, and even stores suffer repeated losses because of them. Collapses, now typical in the urban landscape, are not the result of bombardments of imperialism, rather they are caused by the difficulty of acquiring waterproof construction materials.

In foreign films we often see scenes of crowds in the rain. We are impressed by the image of a cloud of umbrellas that extends the length of a street or the full width of the stands in a stadium. We inevitably compare these scenes with the typical appearance of our streets during a cloudburst: nylon bags used as protection, trying to cover one’s head with the newspaper Granma or a piece of cardboard; older people waiting under the balconies or huddled together at a bus stop.

These are days to ask ourselves when we will have a raincoat – one without holes that fits – let alone what seems to be a pipe dream for so many, when the city will not collapse because of a simple shower that falls in the tropics.


~Yoani Sanchez

The Greatest Scientific Scandal of Our Age

Here's a good summary of why Climategate is the greatest scientific scandal of our generation:

There are three threads in particular in the leaked documents which have sent a shock wave through informed observers across the world.

1.
Perhaps the most obvious, as lucidly put together by Willis Eschenbach (see McIntyre's blog Climate Audit and Anthony Watt's blog Watts Up With That ), is the highly disturbing series of emails which show how Dr Jones and his colleagues have for years been discussing the devious tactics whereby they could avoid releasing their data to outsiders under freedom of information laws. They have come up with every possible excuse for concealing the background data on which their findings and temperature records were based. Most incriminating of all are the emails in which scientists are advised to delete large chunks of data, which, when this is done after receipt of a freedom of information request, is a criminal offence. But the question which inevitably arises from this systematic refusal to release their data is – what is it that these scientists seem so anxious to hide?

2. The second and most shocking revelation of the leaked documents is how they show the scientists trying to manipulate data through their tortuous computer programs, always to point in only the one desired direction – to lower past temperatures and to "adjust" recent temperatures upwards, in order to convey the impression of an accelerated warming. What is tragically evident is the picture of the CRU scientists hopelessly at sea with the complex computer programs they had devised to contort their data in the approved direction, more than once expressing their own desperation at how difficult it was to get the desired results. This comes up so often that it becomes the most disturbing single element of the entire story.

3.
The third shocking revelation of these documents is the ruthless way in which these academics have been determined to silence any expert questioning of the findings they have arrived at by such dubious methods – not just by refusing to disclose their basic data but by discrediting and freezing out any scientific journal which dares to publish their critics' work. It seems they are prepared to stop at nothing to stifle scientific debate in this way, not least by ensuring that no dissenting research should find its way into the pages of IPCC reports.

Conclusion: Our hopelessly compromised scientific establishment cannot be allowed to get away with a whitewash of what has become the greatest scientific scandal of our age.

~Christopher Booker, author of "The Real Global Warming Disaster: Is the Obsession with 'Climate Change' Turning Out to be the Most Costly Scientific Blunder in History?" writing in
The Telegraph

Thanks to Warren Meyer at Coyote Blog.

First 2-Month Restaurant Index Gain (%) in 3 Years


The outlook for the restaurant industry improved somewhat in October, as the National Restaurant Association's comprehensive index of restaurant activity registered its first gain in three months. The Association's Restaurant Performance Index (RPI) a monthly composite index that tracks the health of and outlook for the U.S. restaurant industry stood at 98.0 in October, up 0.5% from its September level (see top chart above). However, the RPI still remained below 100 for the 24th consecutive month, which signifies contraction in the index of key industry indicators. Although restaurant operators continue to report soft samestore sales and customer traffic levels, they are somewhat more optimistic about improving conditions in the months ahead.

MP: Although not reported by the NRA, the bottom chart above shows the percentage change in the RPI from the same month in the previous year. Following negative year-to-year growth in 23 out of 24 months from September of 2007 through August 2009, there have been positive increases in September and October of this year, marking the first back-to-back monthly increases since the summer of 2006. Further, the October-to-October gain of 0.93% is the single largest monthly gain since a 1.3% increase in September 2006, more than three years ago.

Online Black Friday Spending Up By 11% vs. 2008

ComScore, a leader in measuring the digital world, today reported holiday season retail e-commerce spending for the first 27 days of the November – December 2009 holiday season. For the holiday season-to-date, $10.57 billion has been spent online, marking a 3-percent increase versus the corresponding days last year. Black Friday (November 27) saw $595 million in online sales, making it the second heaviest online spending day to date in 2009 and representing an 11-percent increase versus Black Friday 2008.

Saturday, November 28, 2009

The Rich Are Getting Richer and the Poor Are Getting Richer; The Good Old Days Are Now

Click to enlarge.
Steve Horwitz at the Austrian Economists blog has a good post based on Census Bureau data that were recently released on "Living Conditions in the United States, 2005." The chart above (click to enlarge) shows the percentage of all U.S. households owning various household appliances in 1971 and 2005, and the percentage of poor households (below the official poverty line) owning those appliances in 2005. The data show a significant improvement in living standards between 1971 and 2005, as the percentage of households with clothes dryers increased from 44.5% to 81.2%, the percentage of households with dishwashers increased from 18.8% to 64%, and the percent of household with air conditioners increased from 31.8% to 85.7%.

Related
data from the Department of Energy (based on Census Data) in the chart show that the percentage of households owning two or more vehicles increased from 34.8% in 1970 to 57% in 2000, and has likely increased since then.

What's most impressive though is the comparison of the living standards of households living below the poverty line in 2005 to all U.S. households in 1971. By almost every measure of appliance ownership, poor American households in 2005 had much better living conditions than the average American household in 1971, since poor households in 2005 had much higher ownership rates for basic appliances like clothes dryers, dishwashers, color TVs, and air conditioners than all households did in 1971.

As Steve Horwitz concludes "Life for the average American is better today than 35 years ago, life for poor Americans is much better than it was 35 years ago, and poor Americans today largely live better than the average American did 35 years ago. Hard to square with a narrative of economic stagnation or decline."

The reasons for the significant improvements in living standards for all Americans (at all income levels) include innovation, technology improvements, supply chain efficiencies, increases in productivity and other market-driven efficiencies that drive prices lower and lower year by year, measured in what is most important: our time, and the amount of labor it takes to earn the money to purchase household appliances and other goods and services.

Time Value of Common Household Appliances, 1973 vs. 2009
The chart above (click to enlarge) shows retail prices for eleven different household appliances in both 1973 (data here) and 2009 (data here), and the cost of those appliances measured in "hours of work" at the average hourly wage for all industries (BLS data here, $4.12 in 1973 vs. $18.72 today). The charts shows significant reductions in the real cost of basic household appliances between 1973 and today of from -50.7% for a basic kitchen stove (70.4 hours in 1973 vs. 34.7 hours in 2009) to -83.5% for color TVs (97.1 hours in 1973 vs. 16 hours in 2009), and an average reduction in real cost of more than 70% between 1973 and 2009. In other words, to purchase those 11 basic household appliances in 1973 would have taken 551.1 hours of work, 13.8 weeks or 3.4 months working full-time at the average hourly wage in 1973. To purchase those same eleven appliances in 2009 would have only taken 171 hours of work, or 4.3 weeks or 1.1 month. Or the typical worker in 1973 would have had to work from January 1 until the second week of April to earn enough income to purchase those 11 appliances (pre-tax), whereas a worker today would only have to work from January 1 until the first few days of February to earn income for those appliances.
Bottom Line: As much as we hear about declines in median income, economic stagnation, the disappearance of the middle class, falling real wages, increasing income inequality, the data tell a much different story: The rich are getting richer and the poor are getting richer.

Friday, November 27, 2009

Another V-Sign: Manufacturing Overtime Hours

Scott Grannis writes about another V-sign of the economic recovery: the rebound in real personal consumption expenditures:

The turnaround has nothing to do with cash-for-clunkers, since that washed out of the numbers by the end of October (i.e., some spending was accelerated, followed by some payback). On balance, real spending increased in 5 out of the six months ending October, and it rose at a 2.6% annualized rate in the four months following the likely end of the recession in June.

Scott concludes:

Things could be a lot better, to be sure, but there are things to be thankful for this Thanksgiving. One year ago we were standing on the edge of a fearsome abyss, while today we are arguing about how fast the economy is going to grow.

MP: Another V-sign of economic recovery is the turnaround in overtime hours for manufacturing workers (see chart above). The 23.1% increase over the last seven months, from 2.6 hours in March to 3.2 hours in October, is the largest 7-month percentage increase in manufacturing overtime hours since 1983 following the 1982 recession.

See related from today's Wall Street Journal "
Overtime Creeps Back Before Jobs," which starts by saying that "Overtime is returning at many manufacturers, boosting workers' battered wages and helping companies increase output during a period of uncertain growth."

Fattened Up Over Time: Turkeys and Americans

THE ECONOMIST - Between 1960 and 2008, turkeys bulked up by around 11 pounds to 29 pounds, an increase of 64%. Coincidentally, in that same period the average American man gained 28 pounds (166.3 pounds to 194.3 pounds, a 16.8% increase), almost the equivalent of a turkey (see chart above).

Update: "Recently I asked an acquaintance in Bombay why he has been trying so hard to relocate to America. He replied, “I really want to move to a country where the poor people are fat.” From Dinesh D'Souza's column "What's So Great About America."

What If Food Shopping Worked Like Health Care?

Watch the video.

Thursday, November 26, 2009

Help Wanted: No Real World Experience Required

Great post and graph on the Enterprise blog from my friend and colleague at the American Enterprise Institute Nick Schulz.

The Marvel and Mystery of the World

But we can all remind ourselves that the richness of this country was not born in the resources of the earth, though they be plentiful, but in the men that took its measure. For that reminder is everywhere—in the cities, towns, farms, roads, factories, homes, hospitals, schools that spread everywhere over that wilderness.

We can remind ourselves that for all our social discord we yet remain the longest enduring society of free men governing themselves without benefit of kings or dictators. Being so, we are the marvel and the mystery of the world, for that enduring liberty is no less a blessing than the abundance of the earth.


~Annual
Wall Street Editorial on the day before Thanksgiving

Wednesday, November 25, 2009

First Retail Clinic Opens in DC 2 Miles from Capitol

FOX BUSINESS NEWS -- MinuteClinic, the pioneer and largest provider of retail-based health care in the United States, has opened its first retail health care center in Washington, D.C. inside a CVS/pharmacy store on Bladensburg Road. The clinic is open seven days a week and will serve patients in Northeast neighborhoods, including Trinidad, Carver Langston, Kingman Park, Atlas District, Ivy City and the Gallaudet University campus.

"Through this conveniently located store-based clinic, we are expanding access to high-quality, affordable care for common family illnesses in the Northeast neighborhoods of the District of Columbia," said Andrew Sussman, M.D., MinuteClinic president. "We are committed to making our innovative model, which includes a series of prevention and wellness services, part of the District's extensive efforts to broaden access to quality medical care for its citizens."

The MinuteClinic health care center in Northeast is open Monday - Friday from 8:30 a.m. to 7:30 p.m., Saturday from 9 a.m. to 5:30 p.m. and Sunday from 10 a.m. to 5:30 p.m. Examinations typically take 10-15 minutes and no appointment is necessary.

Additional MinuteClinic locations are expected to open inside CVS/pharmacy stores in the District of Columbia in 2010. There are 23 MinuteClinic health care centers inside select CVS/pharmacy stores in Northern Virginia and Maryland counties surrounding the District of Columbia.

MP: While Congress considers how to bring down health care costs and expand access to medical care through various grandiose government interventions, programs and public options (and they've got 2,000 pages worth of "health care reform" to prove it), the private marketplace is already doing it - lowering costs and expanding access at more than 1,000 retail clinics (with maybe as many as 4,000 by 2015, see chart above). And unlike government-based health care reform, the explosion of affordable, convenient retail health clinics across the country didn't require any tax increases, government spending or funding, or special legislation.

Isn't it ironic that within a week of the Senate vote to start debate on health care reform, the first retail clinic opens in Washington, D.C. less than two miles from the U.S. Capitol? Could the senators maybe take a field trip to the clinic to see what market-based health care reform looks like before they plot their takeover of the health care system?

New Home Sales Highest in a Year, Inventory Measure of New Homes Lowest Since 2006


WASH POST --Sales of newly built homes rose to the highest level in more than a year while the supply of these homes dropped to new lows, according to government data released on Wednesday.

Purchases of single-family homes rose 6.2% in October from September to a seasonally adjusted annual rate of 430,000, the Commerce Department reported. The jump was driven solely by the South, the largest new home sales market in the nation. That region, which includes the Washington, D.C. area, posted a 23% gain while sales in other regions slipped.

Meanwhile, the supply of new homes has plummeted to the lowest level in nearly four decades, a promising sign that supply and demand for new homes will soon fall in line and help stabilize home prices.

MP: The months supply of homes at the current sales rate fell to 6.7 months in October, the lowest reading since December 2006 (see bottom chart above), almost three years ago. The balance between supply and demand for new homes is returning to the conditions of a normal housing market, and the October inventory of 6.7 months supply is just slightly above the average inventory of 6.13 months, based on new home sales data going back to 1963.

Giving Thanks for Capitalism, The Invisible Hand, the Miracle of the Free Market and No Turkey Czars

Like in previous years, you probably didn't call your local supermarket ahead of time and order your Thanksgiving turkey this year. Why not? Because you automatically assumed that a turkey would be there when you showed up, and it probably was there when you showed up "unannounced" at the grocery store to select your bird.

The reason your Thanksgiving turkey was waiting for you without an advance order? Because of "spontaneous order," "self-interest," and the "invisible hand" of the free market - "the mysterious power that leads innumerable people, each working for his own gain, to promote ends that benefit many." And even if your turkey appeared in your local grocery stores only because of the "selfishness" or "corporate greed" of thousands of turkey farmers, truckers, and supermarket owners who are complete strangers to you and your family, it's still part of the miracle of the marketplace where "individually selfish decisions lead to collectively efficient outcomes."

In a 2003 Boston Globe column titled "Giving Thanks for the Invisible Hand" Jeff Jacoby explains below why he is thankful for the miracle of the invisible hand that makes affordable turkeys automatically available so efficiently at Thanksgiving:

The activities of countless people over the course of many months had to be intricately choreographed and precisely timed, so that when you showed up to buy a fresh Thanksgiving turkey, there would be one -- or more likely, a few dozen -- waiting. The level of coordination that was required to pull it off is mind-boggling. But what is even more mind-boggling is this: No one coordinated it.

No turkey czar sat in a command post somewhere, consulting a master plan and issuing orders. No one forced people to cooperate for your benefit. And yet they did cooperate. When you arrived at the supermarket, your turkey was there. You didn't have to do anything but show up to buy it. If that isn't a miracle, what should we call it?

Adam Smith called it "the invisible hand" -- the mysterious power that leads innumerable people, each working for his own gain, to promote ends that benefit many. Out of the seeming chaos of millions of uncoordinated private transactions emerges the spontaneous order of the market. Free human beings freely interact, and the result is an array of goods and services more immense than the human mind can comprehend. No dictator, no bureaucracy, no supercomputer plans it in advance. Indeed, the more an economy *is* planned, the more it is plagued by shortages, dislocation, and failure.

It is commonplace to speak of seeing God's signature in the intricacy of a spider's web or the animation of a beehive. But they pale in comparison to the kaleidoscopic energy and productivity of the free market. If it is a blessing from Heaven when seeds are transformed into grain, how much more of a blessing is it when our private, voluntary exchanges are transformed - without our ever intending it - into prosperity, innovation, and growth?

Jobless Claims Drop for 12th Week; Falling to Below 500,000 For First Time Since Nov. 2008

The Department of Labor reported today that jobless claims (four-week moving average) dropped for the 12th straight week, and fell below 500,000 for the first time since November 8, 2008. The 16,500 drop in jobless claims to 496,500 from last week's 513,000 was the third largest weekly decline this year, behind a 22,000 drop in July and a 26,000 drop in January.

It might be happening slowly, but the labor market is gradually recovering.

Quote of the Day: H.L. Mencken

The urge to save humanity is almost always a false front for the urge to rule it.

~H. L. Mencken

Climategate

Recently leaked emails and documents from the Climate Research Unit at the University of East Anglia in the United Kingdom expose deceit, duplicity and collusion between climate researchers to maintain the fraud of the manmade global warming theory. These emails reveal stunning behind-the-scenes details about how this fraud has been developed and perpetuated. In this video historical climatologist and retired university professor Dr. Timothy F. Ball shares his insights on what they show.


Here are several more links on Climategate:

CLIMATE BOMBSHELL: Hacker leaks thousands of emails showing conspiracy to "hide" the real data on manmade climate change

The Death Blow to Climate Science

And of course, Wikipedia already has a webpage: Climatic Research Unit e-mail Hacking Incident


Tuesday, November 24, 2009

Price War Brews Between Amazon and Wal-Mart; Cutthroat Competition is a Consumer's Best Friend

Wal-Mart, the mightiest retail giant in history, may have met its own worthy adversary: Amazon.com. In what is emerging as one of the main story lines of the 2009 post-recession shopping season, the two heavyweight retailers are waging an online price war that is spreading through product areas like books, movies, toys and electronics.

The tussle began last month as a relatively trivial but highly public back-and-forth over which company had the lowest prices on the most anticipated new books and DVDs this fall. By last week, it had spread to select video game consoles, mobile phones, even to the humble Easy-Bake Oven, a 45-year-old toy from Hasbro that usually heats up small cakes, not tensions between billion-dollar corporations.

Last Wednesday, Wal-Mart dropped the price of the oven to $17, from $28, as part of its "Black Friday" deals. Later the same day, Amazon cut its price, which had also been $28, to $18. "It’s not about the prices of books and movies anymore. There is a bigger battle being fought," said Fiona Dias, executive vice president at GSI Commerce, which manages the Web sites of large retailers. "The price-sniping by Wal-Mart is part of a greater strategic plan. They are just not going to cede their business to Amazon."

Chart of the Day: Medical School Graduates

The chart above displays the gender breakdown for medical school graduates back to 1961 (data here), showing the dramatic shift over time towards gender equality. In 1961, men outnumbered women by more than 17 to 1 (94.5% to 5.5%), and by 2006 it was almost evenly split between male and female graduates (51.3% male vs. 48.7% female for 2009).

Life Is Getting Measurably Better for Many People Here and Abroad; There's A Lot to Be Thankful For

From today's Wall Street Journal, "20 Advances to Be Thankful For":

News about health often focuses on the negative: scary new flu viruses, incurable diseases, dashed hopes for miracle drugs. Maybe that's because we have such high expectations that doctors and scientists can fix anything. But amid all that bad news—not to mention the acrimony over health-care reform—it's easy to overlook how much progress has been made in recent years. Here are 20 health-care advances to give thanks for this Thanksgiving (see four of the 20 below):

1. Life expectancy in the U.S. reached an all-time high of 77.9 years in 2007, the latest year for which statistics are available, continuing a long upward trend (see chart above, data here). (That's 75.3 years for men and 80.4 years for women.)

2. Fewer Americans died in traffic fatalities in 2008 than in any year since 1961, and fewer were injured than in any year since 1988, when the National Highway Traffic Safety Administration began collecting injury data. One possible reason: Seat-belt use hit a record high of 84% nationally.

3. The death rate from cancer, the second-biggest killer, dropped 16% from 1990 to 2006. That reflects declines in deaths due to lung, prostate, stomach and colorectal cancers in men, and breast, colorectal, uterine and stomach cancers in women.

4. Death rates dropped significantly for eight of the 15 leading causes of death in the U.S., including cancer, heart disease, stroke, hypertension, accidents, diabetes, homicides and pneumonia, from 2006 to 2007. (Of the top 15, only deaths from chronic lower respiratory disease increased significantly.) The overall age-adjusted death rate dropped to a new low of 760.3 deaths per 100,000 people—half of what it was 60 years ago.


MP: Not sure exactly what happened, but it looks life expectancy really took a dive during the Great Depression, dropping by almost five years from 63.3 years in 1933 to 58.5 years by 1936.

Fourth Monthly Increase in Case-Shiller Price Index


Washington -- The Standard & Poor's/Case-Shiller home price index of 20 major cities rose only 0.3% to 144.96 in September, but it was the fourth straight monthly increase (see bottom chart above, first time since early 2006 of four consecutive increases). The seasonally adjusted index is now up more than 3% from its bottom in May, but still 30% below its peak in April 2006.

Guess Who's Coming to Your Thanksgiving Dinner?

According to the American Farm Bureau Federation, the average cost for a Thanksgiving feast for ten lies at $42.91 in 2009. The menu items for a classic Thanksgiving dinner used for their survey include turkey, bread stuffing, sweet potatoes, rolls with butter, peas, cranberries, a relish tray of carrots and celery, pumpkin pie with whipped cream, and beverages of coffee and milk. Of that, of course, the turkey is the largest cost factor at an average price of $18.65 for a 16-pound bird. Because Thanksgiving is a celebration, for our calculations, we also factored in five bottles of wine at an average price of $7.35, which brings the total cost of the average Thanksgiving feast to $79.67.

But not all of that reflects the actual cost of your meal – a large chunk of it is taken by the government in some form or another:

On top of the direct excise taxes on the wine, there are taxes paid by the farmers, winemakers, manufacturers, wholesalers, distributors and shippers, retailers, warehouses. To be more specific, out of what the consumer pays, the producers and sellers must pay federal income taxes, state income taxes, federal payroll taxes, unemployment insurance taxes, workmen’s compensation taxes, state franchise taxes, local property taxes and any local income taxes. All told, for a Thanksgiving feast for a family of ten, the government takes a bite of 40.91%, or $32.59.

~Americans for Tax Reform


From Treasury: Invitation to Financial Bloggers

A little late, but a newsworthy report from the NY Times (11/15/2009):

Mr. Geithner, the Treasury secretary, was among the senior officials who talked with bloggers at an outreach session on Nov. 2. The two-hour round table was held on background, meaning that the bloggers could describe the sessions, but not attribute quotes to specific officials. Lengthy posts about financial system reforms — and the bloggers’ disagreements with the Treasury’s strategies — ensued. New-media scribes have gradually made their way inside most governmental institutions over the years, but the meeting was the first for bloggers at the Treasury.

Andrew Williams, a spokesman for the Treasury who assembled the event, said that Mr. Geithner had “long valued the blogosphere” and mentioned that during Mr. Geithner’s tenure as the president of the New York Federal Reserve Bank, he had requested a daily compendium of relevant blog posts. Another reason for the outreach, Mr. Williams said, is that the blogs are influential, especially because they are read by reporters at more traditional outlets.

Markets in Everything: Vacant House Parties

SANDY SPRINGS, Ga.Some of the most elegant addresses in all of Atlanta are found in this wealthy enclave. Sprawling mansions that occupy 2- to 10-acre lots are home to some of the city's most prominent residents.


They were shocked last month when a massive Halloween party exploded in their midst. More than 1,000 people jammed the streets around the brick-and-rock mansion, paying $20 apiece for admission and riding shuttle buses from the parking lot of a nearby Publix grocery, police say.

The Halloween party was the latest of several in Sandy Springs in which empty mansions are rented for huge parties that draw complaints from neighbors. The Sandy Springs party planner was charged only with disorderly conduct, a misdemeanor, because he had permission from the property manager to host a party.


Monday, November 23, 2009

Sideways Discrimination: An Important Lesson

Steven E. Landsburg has argued in his book Fair Play and now on his new blog that it’s generally acceptable (morally and legally) for tenants to discriminate against landlords, and workers to discriminate against employers, but not vice-versa.

Here's how he explains it in
Fair Play:

Let me illustrate with a stylized example economists love so much. Mary owns a vacant apartment; Joe is looking for a place to live. If Joe disapproves of Mary's race or religion or lifestyle, he is free to shop elsewhere. But if Mary disapproves of Joe's race or religion or certain aspects of his lifestyle, the law requires her to swallow her misgivings and rent the apartment to Joe.


Or: Bert wants to hire an office manager and Ernie wants to manage an office. The law allows Ernie to refuse any job for any reason. If he doesn't like Albanians, he doesn't have to work for one. Bert is held to a higher standard: If he lets it be known that no Albanians need apply, he'd better have a damned good lawyer.

These asymmetries grate against the most fundamental requirement of fairness--that people should be treated equally, in the sense that their rights and responsibilities should not change because of irrelevant external circumstances. Mary and Joe--or Bert and Ernie--are looking to enter two sides of one business relationship. Why should they have asymmetric duties under the antidiscrimination laws?

When the law is so glaringly asymmetric, one has to suspect that the legislature's true agenda is not to combat discrimination on the basis of race, but to foster discrimination on the basis of social status. By holding employers and landlords to a higher standard than employees and tenants, the lawmakers reveal their underlying animus toward employers and landlords.

We've heard a lot--and I suspect more than enough (in the sense that nobody any longer has anything new to say on this subject)--about reverse discrimination, where the law distinguishes unfairly between blacks and whites. But we've heard far too little about sideways discrimination, where the law distinguishes unfairly between, say, landlords and tenants.

More recently on his blog:

If you don’t want to live in an Albanian-owned building or an work for an Albanian employer, that’s your right (no matter how strongly we might strongly disapprove of your attitude). By analogy, then, it might seem that landlords and employers should have the same right to discriminate.


Now clearly the situation is not that simple; landlords and employers are not the same as tenants and employees. But the question is: Are they not the same in any way that is morally relevant? The most frequently cited difference (in my experience) is that landlords and employers tend to have more market power than tenants and workers. Putting aside the question of whether that’s true, it can’t possibly be a full justification for treating landlords and employers differently, and here’s why: There are plenty of instances where we don’t think that market power takes away your right to discriminate. Extremely attractive people have a lot of power in the dating market, but I think it’s safe to say that almost nobody thinks the most beautiful among us should be forced to date Albanians, or to prove that they choose their partners according to some objective criterion other than national origin.

So if you think it’s OK for tenants to discriminate but not landlords, you’ve got to face the question: What is the ethically relevant distinction here? It’s clearly not market power, so what, if anything, is it? I do not deny that there might be a good answer to that question, but I must admit I can’t imagine what it would be.

MP: I presented this dilemma in an economics class once about ten years ago at the University of Michigan-Flint to provoke some discussion on the economics of discrimination, and made the mistake of using blacks in the example instead of Albanians, and was accused by a black student of being racist - the emails and anti-racist literature that I received went on for several weeks. It reminds of the Norwegian proverb "Experience is the best teacher, but the tuition is high."


More Health-Care Lessons from India

From the Salon.com article "How I Got Well in India for $50: My cheap, fast and effective treatment in New Delhi reminded me of everything wrong with American healthcare":

I had anticipated getting sick in India. What I hadn't anticipated was that India's treatment would turn out to be so good. And cheap. Unless you happen to be one of the hundreds of millions of Indians who are poor and don't live in a major metropolitan area. The Indian healthcare system is an anarchic hodgepodge, with little insurance, little regulation and a range of services offered by hundreds of government-run, trust-run and corporate hospitals. The care it produced for me was fast, effective, courteous and cheaper than American medicine, even when adjusted for the lower cost of living.

The cost to see the doctor (a gastroenterologist, for a bacterial infection)? $6. The pharmacy bill was about $1. Total cost, $7, with no insurance company involvement whatsoever.

In some ways, the Indian system is like the U.S. system before the spread of private insurance -- that extra layer of bureaucracy is still not a major factor in Indian healthcare costs. Private insurance costs help explain why the U.S. spends a greater percentage of its GDP on healthcare than the European democracies. The Indian system of health insurance also works differently, in a way that holds down costs. Those Indians who do have private insurance pay their bills out of pocket -- to doctors who don't charge much because of all the competition -- and then get reimbursed. The insurance companies aren't the ones setting the rates or acting as the middle man.

Almost 25,000 doctors graduate from India's medical schools every year. Because there is so much competition, doctors and hospitals are forced to keep their prices low to get patients. Residents, who go to medical school straight from high school, only make the equivalent of a few hundred dollars a month. An average surgeon's salary would be around $8,000 per month.

HT: Colin Grabow

India's $2k Open-Heart Surgery, Henry-Ford Style

BANGALORE (WSJ) -- Dr. Devi Shetty, who entered the limelight in the early 1990s as Mother Teresa's cardiac surgeon, offers cutting-edge medical care in India at a fraction of what it costs elsewhere in the world. His flagship heart hospital charges $2,000, on average, for open-heart surgery, compared with hospitals in the U.S. that are paid between $20,000 and $100,000, depending on the complexity of the surgery.

The approach has transformed health care in India through a simple premise that works in other industries: economies of scale. By driving huge volumes, even of procedures as sophisticated, delicate and dangerous as heart surgery, Dr. Shetty has managed to drive down the cost of health care in his nation of one billion.

His model offers insights for countries worldwide that are struggling with soaring medical costs, including the U.S. as it debates major health-care overhaul.


~From the article "The Henry Ford of Heart Surgery In India, a Factory Model for Hospitals Is Cutting Costs and Yielding Profits."

Health Care Hoops: The Public Option


Home Sales at Highest Level and Months Supply of Inventory at Lowest Level, Both Since Feb. 2007


Highlights from today's report on existing home sales:

1. Existing-home sales – including single-family, townhomes, condominiums and co-ops – surged 10.1% to a seasonally adjusted annual rate of 6.10 million units in October from a downwardly revised pace of 5.54 million in September, and are 23.5% above the 4.94 million-unit level in October 2008. Sales activity is at the highest pace since February 2007 when it hit 6.55 million.

2. The inventory of existing homes for sale in October fell to 3.57 million homes, the lowest level in more than a year. At the current sales pace, there is now a 7.0 months supply of existing homes, which is the lowest level since February 2007, more than two and a half years ago (see top chart above). Compared to the peak of 11.3 months supply of inventory in April, October's 7.0 months supply represents a reduction of 4.3 months.

Bottom Line: The national real estate market is gradually recovering as the balance between the supply and demand (measured by the months supply of inventory) has returned to the 2006-2007 levels, suggesting that the worst is definitely behind us.

More on the Gender Gap for SAT Math Test Scores

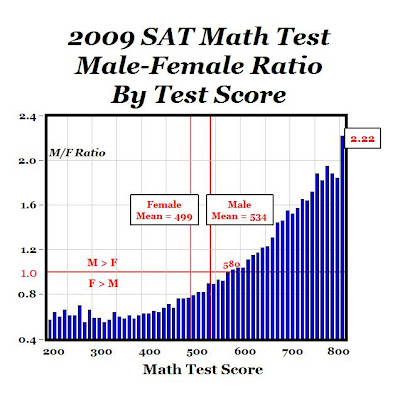
A previous CD post showed that high school boys outperform high school girls for high SAT math test scores (see chart above, data here). For perfect 800 scores on the 2009 math SAT test, the ratio of boys to girls is 2.22 to 1 (6,928 to 3,124). What makes this outcome even more interesting are the following data from this SAT report from the College Board:

1. Girls are over-represented in the top 10% of high school students by GPA, which is 57% female and 43% male. Girl also outnumber boys in the second tenth of students by high school rank: 54% to 46%.

2. Girls outnumber boys for GPAs of A+ (60% vs. 40%), A (61% vs. 39%), A- (57% vs. 43%), etc.

3. The average number of years of math study is almost identical: 3.9 years for boys and 3.8 years for girls.

4. For students reporting more than four years of math study, the percentages are equal: 50% of boys and 50% of girls.

5. Both 50% of boys and 50% of girls report that calculus is the highest level of high school mathematics taken.

6. More girls than boys took AP Honors math courses, by a ratio of 117 girls for every 100 boys.

Therefore, it would seem that girls are equally prepared, if not more prepared (more AP math classes), than boys for the SAT math test, and yet boys outperform girls measured both by the difference in mean scores (35 point difference in favor of boys) and the over-representation of boys for scores on the high end (2.22 to 1 ratio for perfect scores), and these differences persist over time.


Sunday, November 22, 2009

800 SAT Math Scores: Male-Female Ratio is 2.22:1

The chart above shows the male-female test score ratio for the 2009 SAT math test (data here). For example, for perfect scores of 800, males (6,928) outnumbered females (3,124) by a ratio of 2.22 to 1. In other words, 69% of test-takers who got perfect math scores were males vs. 31% of perfect scores by females. Or we could also say that there were 222 high school boys who got perfect SAT math scores for every 100 high school girls.

The graph further shows that boys outperformed girls at all 23 math test scores between 580-800 (10 point intervals, with male-female ratios of 1.0 or above), and then for math test scores between 200 points and 570, girls outnumbered boys (male-female ratio below 1.0).

Further, the graph shows that the mean SAT math test score for high school boys was 534, and 35 points higher than the mean female SAT math test score of 499. And based on
data here, the standard deviation of male math SAT test scores was 118 (variance of 13,924) compared to the standard deviation for females of 112 (variance of 12,544), for a Male-Female variance ratio of 1.11.

If we are trying to explain the over-representation of males in science, math and engineering departments at MIT and Harvard, especially if that group represents those who score 800 on the SAT math test, the explanation seems pretty clear, convincing and straightforward: males are over-represented by a factor of more 2:1 for SAT math test scores of 800 points.

Bottom Line: Can Larry Summers get his job back as president of Harvard,
for saying basically the same thing?


"It does appear that on many, many different human attributes- height, weight, propensity for criminality, overall IQ, mathematical ability, scientific ability - there is relatively clear evidence that whatever the difference in means - which can be debated (MP: Actually for math SAT scores, there is no debate) - there is a difference in the standard deviation, and variability of a male and a female population."

Update: Adjusting for the fact that more girls than boys take the SAT (as suggested in the comments by Dr. T) makes my case even stronger, since 0.974% of boys scored 800 on the SAT math test vs. 0.386% of girls, for a ratio of 2.52 to 1 in favor of boys for perfect math test scores of 800, even greater than the 2:22 to 1 ratio for unadjusted scores (see graph above).


Despite Recession, Innovation Is Alive and Well

Click to enlarge.
From the press release for Booz & Company's 2009 edition of the Global Innovation 1000:

In the face of a severe global recession, the world’s 1,000 largest publicly traded corporate research and development spenders increased R&D budgets in 2008, affirming the critical importance of innovation to their corporate strategies, according to Booz & Company’s Global Innovation 1000, the global management consulting firm’s fifth annual analysis of global innovation spending. R&D spending at these firms rose 5.7% in 2008, a slower rate of growth than the prior year’s 10% increase, but in line with the group’s 6.5% increase in worldwide sales. More than two-thirds of the companies included in this year’s Global Innovation 1000 maintained or increased R&D spending in 2008, even though a third of the companies reported a financial loss for the year.

Judging from the data in this year’s study, the results of the senior management survey, and conversations with executives, the recession’s effect on innovation activity has not been as severe as some observers of the business scene might have anticipated. Innovation has become central to every company’s efforts to compete, and the degree of competition has been in no sense reduced by the downturn; if anything, it has been heightened. Long product development cycles have forced companies to maintain their R&D spending even when revenues decline. And most companies are fully aware of the need to be in position to profit from the coming upturn.


From the study's conclusion "The Downturn's Upside":

Virtually all the companies we contacted noted that they have learned to streamline R&D processes, to make sure their product development filters more effectively reflect economic reality, to make smart bets on advantaged technologies, and to kill weak projects more quickly. All these changes should help them get more from their R&D investments over time. As we head into a better business environment, smart companies will see this recession as a learning experience. Every company should take the time to assess the strengths and weaknesses of its innovation systems and processes. The downturn no doubt revealed some major gaps in innovation capabilities. Fix them now. Doing so right away will pay dividends in terms of speed-to-market, quality of execution, and capacity - both in the coming upturn and well into the future.

The Economy is So Bad That.....

I opened the mail and found a pre-declined credit card.

I ordered a Whopper at Burger King and they asked me, "Can you afford fries with that?"

Exxon-Mobil laid off 25 Congressmen.

The bank returned my check marked "Insufficient Funds" and I had to call them to ask if they meant me or them.

The Mafia is laying off judges.

A truckload of Americans was caught sneaking into Mexico.

Read more here.

Saturday, November 21, 2009

With HSAs, Mammogram Frequency Is A Non-Issue?

The NY Times blog has an article "The Uproar Over Mammography," which links to a WSJ op-ed "A Breast Cancer Preview: The mammogram decision is a sign of cost control to come."

In a world of consumer-driven health care that includes Health Savings Accounts (HSAs), wouldn't this "uproar" be a complete non-issue? In that world, patients spending their own money could make decisions on their own, in consultation with their physician, about the timing and frequency of their mammograms.

Think about oil changes for your car. If the manufacturer recommends oil changes every 5,000 miles, but you decide on a different frequency - say every 3,000 miles or every 10,000 - that's not a problem. Now if your car insurance covered routine oil changes, and then the government introduced "government car insurance reform" with a "public option," then the frequency of oil changes would become an issue and could lead to an "uproar."

But in a world of consumer-driven health or auto care where consumers pay for routine maintenance or health exams, there's no "uproar," since consumers make decisions on the frequency of their oil changes or mammograms, and are directly responsible for the cost.

However, there's just one small problem - Senator Harry Reid wants to "kill consumer-driven health care" with the Senate's health-care "reform" bill (which would assault HSAs), read the WSJ editorial "The End of HSAs."

Approval-Disapproval Gap Drops from 56 Points to 5


According to Gallup, the percent of Americans who approve of President Obama has dropped by 19 points from 68% in late January to 49% currently (new low). During the same period, disapproval increased from 12% to 44% (new high). Therefore, the approval-disapproval gap has shrunk from 56 points in January (68%-12%) to only 5 points now (49%-44%), a new low. Read more here.

Friday, November 20, 2009

The Power of the Blog: Obama Responds to Yoani

Committee to Protect Journalists -- Cuban blogger Yoani Sánchez was astounded this week by President Barack Obama’s decision to respond a written questionnaire Sánchez submitted to the White House. Still recovering from bruises left by a recent vicious attack by state security agents, she told CPJ from her home in Havana: “This is the best way to get better.”

The blogger said that she had tried for months to reach the U.S. president through different channels. Sánchez said she had sent written questions to Obama through a wide range of different people before the White House responded. On her blog Generación Y, where she has posted Obama’s answers to her seven questions, Sánchez explained that the questions were based on issues “that keep me from sleeping,” and were born from her personal experience.

“It was a very pleasant surprise,” Sánchez said, acknowledging that the chances that Obama would reply were minimal. Before responding to the questions, Obama thanked Sánchez for the opportunity to exchange views with her and her readers in Cuba, and congratulated her for receiving Columbia’s University Maria Moors Cabot Award for excellence in Latin American reporting.

“Your blog provides the world a unique window into the realities of daily life in Cuba,” Obama wrote. “It is telling that the Internet has provided you and other courageous Cuban bloggers with an outlet to express yourself so freely, and I applaud your collective efforts to empower fellow Cubans to express themselves through the use of technology. The government and people of the United States join all of you in looking forward to the day all Cubans can freely express themselves in public without fear and without reprisals.”

See my post today on the Enterprise Blog about Yoani Sanchez, where I conclude that:

When the history of Cuba’s freedom movement is written, it’s likely that Yoani Sanchez will be recognized as a national hero and freedom fighter, the equivalent of Lech Walesa in Poland and Vaclav Klaus in the Czech Republic. Yoani Sanchez demonstrates that we should never underestimate the power of one courageous individual with a computer, a blog, and intermittent access to the Internet, or the individual’s power to change the world in the Information Age, especially with a message of freedom and individual liberty. The fact that the president of the United States, who is often recognized as the most powerful person in the world, has praised Yoani Sanchez’s blog and responded to her questions is a remarkable and historical event. Intellectual figures like Milton Friedman, Friedrich von Hayek, and Thomas Jefferson would be proud of Yoani Sanchez and her powerful message of individual freedom in one of the few remaining regimes of totalitarianism left in the world.

Americans Get Their Driving Mojo Back Over the Summer; Largest 4-Month Increase In 5 Years

The chart above shows the percent change in U.S. traffic volume through September (from the same month in the previous year), in a report released today by the Federal Highway Administration (data and report here). After falling for 17 consecutive months starting in November 2007, traffic volume has increased in each of the last four months. The 2.5% September increase is the largest monthly increase since a 3.8% increase in January 2006, and follows increases of 0.7% in August, 2.2% in July and 1.9% in June, and is the first time since the summer of 2006 that traffic volume has increased four months in a row (see chart). The cumulative 4-month June-Sept. increase of 7.3% is the largest 4-month increase since the 10.8% increase through May 2004, more than five years ago.

The chart below displays traffic volume as a moving 12-month total, showing a similar pattern to the percentage monthly increase above. After falling for 16 straight months going back to December 2007, the moving 12-month total has increased four months in a row, and marks the largest 4-month increase in traffic volume (12-month total) since the spring of 2005, more than four years ago.


LA Shipping Reaches Highest Level Since Nov. 2008


SAN PEDRO, CA (Nov. 13, 2009)Containers shipped through the Port of Los Angeles last month increased 10.9% compared to September, making October the strongest month yet for the Port this calendar year (see top chart above). Both containerized imports and exports reached their highest levels for 2009, with loaded outbound containers seeing an 11.8% rise over October 2008 volumes. Still, loaded inbound containers were 8.3% below October 2008 levels (data here).

Despite a reporting period that included a weeklong observance of a Chinese holiday, the total number of Twenty-Foot Equivalent (20-foot containers or “TEUs”) imported and exported through the Port of Los Angeles in October was 647,423
. Total container volumes were 10.9% above September 2009 levels; loaded imports were up 9.6% and loaded exports were up 7.4% over the previous month. Year to date, TEU volume is at 5,606,798, or 15.4% lower than the same 10-month period in 2008.

MP: Container counts at the LA Port have increased in six out of the last eight months, and reached the highest total level since last November. On a year-to-year percent change basis, the 8.34% decrease in October was the smallest decrease in a year, since the 3.98% decrease from October 2007 to October 2008 (see bottom chart above).

Thursday, November 19, 2009

Lou Dobbs Will Appear on Kudlow Report Tonight

Link.

U.S. Share of World GDP Remarkably Constant

Somewhat surprisingly, the Economic Research Service of the U.S. Department of Agriculture has some great international historical macroeconomic datasets. According to its website:

The International Macroeconomic Data Set provides data from 1969 through 2020 for real (adjusted for inflation) gross domestic product (GDP), population, real exchange rates, and other variables for the 190 countries and 34 regions that are most important for U.S. agricultural trade.


The chart above shows the annual shares of real world GDP for four geographical regions (European Union 15, Asia/Oceania, Latin America and the combined share of Africa and the Middle East) compared to the U.S. share of world GDP between 1969 and 2009 (data here). What might be surprising is that the U.S. share of world GDP has been relatively constant for the last 40 years, and is actually slightly higher in 2009 (26.7%) that it was in 1975 (26.3%). It's also interesting that the EU15's share of world GDP has declined from about 36% of world output in 1969 to only 27% in 2009. Further, despite having a large share of the world's oil reserves, the Middle East's share of global output has increased from only 2.23% in 1969 to 3.16% in 2009 (graph shows Middle East combined with Africa).

Bottom Line: World GDP (real) doubled between 1969 and 1990, and has increased by another 60% since then, so that world output in 2009 is more than three times greater than in 1969. We might mistakenly assume that the significant economic growth over the last 40 years in China, India and Brazil has somehow come "at the expense of economic growth in the U.S." (based on the "fixed pie fallacy") but the data suggest otherwise. Because of advances in technology, innovation, and significant improvements in U.S. productivity, America's share of total world output has remained remarkably constant at a little more than 25%, despite the significant increases in output around the world, especially in Asia.

Update: The chart above represents about 91% of the world economy and does not include Canada and the European countries not included in the EU-15.

Leading Indicators Rise for 7th Month to 2-Yr. High

The Leading Economic Index (LEI) increased for the 7th straight month to 103.8, the highest level since the fall of 2007, and the first time in more than five years of 7-consecutive monthly increases (since early 2004).

Details:

Six of the ten indicators that make up The Conference Board LEI for the U.S. increased in October. The positive contributors – beginning with the largest positive contributor – were the interest rate spread, average weekly initial claims for unemployment insurance (inverted), stock prices, average weekly manufacturing hours, real money supply and manufacturers’ new orders for consumer goods and materials. The negative contributors – beginning with the largest negative contributor – were index of consumer expectations, building permits, index of supplier deliveries (vendor performance), and manufacturers’ new orders for nondefense capital goods.

Odds for Health Care Reform Fall From 50% to 2%

Last summer the odds for a federal government-run health insurance plan to be approved before the end of the year were around 50%, according to futures contracts traded on Intrade.com. Those odds have now fallen to a contract-low of only 2.2%. Odds for health care reform passing by March 2010 or June 2010 are higher, see details here.