Thursday, May 31, 2007

NY Politicians Get Smart: Let the Market Work

From today's NY Times: New York is poised this week to become the latest state to ease or eliminate decades-old restrictions on ticket scalping.

For the first time, it would become entirely legal in the state for average fans to scalp their seats on the Internet. And, for better or worse, they could sell those tickets at what ever price the market is willing to bear.

NY Governor Eliot Spitzer said “Ticket scalping laws historically have not worked. I think permitting a free market to work its magic there is the smart approach.”

Other states have also reconsidered anti-scalping laws. Minnesota tossed its old anti-scalping laws this spring. A bill that would ease Missouri's ban on selling tickets to sporting events at more than face value passed the legislature and is now before the governor.

The shift has been propelled in part by the explosion of Internet ticket sales that has made it nearly impossible for states to enforce price caps. New York's old rule limiting a seller's profits to no more than 45 percent over face value has been widely ignored online.

Another NY Times article on ticket scalping from yesterday is here.

Just wondering, won't this lead to "unconscionably excessive" ticket prices? And "ticket gouging" for sporting events? And doesn't the "free market magic" also apply to gasoline?

Quote of the Day

The First Lesson of Economics: We live in a universe of scarcity, and there is never enough of anything to fully satisfy all those who want it.

The First Lesson of Politics: Disregard the first lesson of economics.

~Thomas Sowell

Pentamillionaire Facts and The Invisible Hand

Amount of wealth required to be in the nation's top 1%: More than $5,000,000

Number of U.S. pentamillionaire ($5m) households in 2007: 930,000

Number of U.S. pentamillionaire households in 1997: 232,000

Percent of the nation's big family fortunes that are less than 13 years old: 70%

Percent of pentamillionaires from passive investments: 10%

Percent of pentamillionaires from inheritance: 10%

Percent of pentamillionaires from either starting their own business or working for a small company that experienced explosive growth: 80%

How most pentamillionaires acquire their wealth: They make up their minds to solve a problem or do something better than it's been done before. And almost all of them made their fortune in a big lump sum after many years of effort.

Source: SmartMoney Magazine, based on a wealth study by the Harrison Group.


Bottom Line: Most wealth is not inherited, and most fortunes are not made passively in the stock market. Rather, wealth and fortunes are mostly created by many years of hard work and effort directed toward "solving a problem or doing something better than it's been done before." In other words, in the self-interested pursuit of wealth, entrepreneurs are led by the "invisible hand" to solve other people's problems, or produce new products for other people, or produce existing products more efficiently for other people, to the great benefit of everybody in society.


Cartoon of the Day

Current teenage unemployment rates for April 2007:

All teenagers: 13.9% (May)

Black teenagers: 30.6%

Male black teenagers: 34%

Female black teenagers: 27.4%

See related post below, "Politicians Care, But Not About Facts or Reality."


Politicians Care, But Not About Facts or Reality

From "About Those "Skyrocketing" Gas Prices," by Larry Elder

"So let's sum up. Politicians and the mainscream media ignore supply and demand; overlook the impact of federal, state and local taxes on the price of a gallon of gas; disregard the effect of consumers' driving habits; refuse to point out the ineffectiveness of "windfall profits taxes"; and blame Big Oil for refusing to build refineries while ignoring environmental restrictions that make it unprofitable to do so.

But at least they care."

Amen.

CD Milestone: 1000 Postings

Carpe Diem Stats:

Number of Posts: 1000

Number of Days Since CD Started on September 20, 2006: 250

Average Posts Per Day: 4

Total Visits: 76,475

Average Visits Per Day: 302

The Sitemeter charts above (click to enlarge) provide additional information on CD.

CARPE DIEM!!

S&P500 Breaks 7-Year Record, Not Yet for NASDAQ

WSJ: "The S&P 500 rallied to a new record close on Wednesday, a long seven years since its prior record close of 1527.46, on March 24, 2000 (see chart above).

To put that lag in perspective, the last time the index hit a record, Bill Clinton was still president, the iPod didn't exist and "American Beauty" was two days away from winning Best Picture at the Academy Awards."


The Nasdaq Composite Index closed at 2592.59, its highest close since Feb. 7, 2001. It is up 7.3% on the year, but is still a long way (2,456 points) from its record close of 5048.62, set on March 10, 2000 (see chart above). In percentage terms, the NASDAQ Index would still have to increase by almost 95% to break the 2000 record close.


Wednesday, May 30, 2007

A Full Tank of Political Hypocrisy

I recently had a post about why $5 per gallon gas would be good for America, because the higher the price and the longer gas stays expensive, the greater the conservation, and the greater the chance we'll someday see viable alternatives. In today's Washington Post, Robert Samuelson has an excellent, related article ("A Full Tank of Hypocrisy"):

It's one of those delicious moments when Washington's hypocrisy is on full and unembarrassed display. On the one hand, some of America's leading politicians condemn high gasoline prices and contend that they stem from "gouging" by oil companies. On the other, many of the same politicians warn against global warming and implore us to curb our use of fossil fuels that emit carbon dioxide, the main greenhouse gas.

Guess what: These crowd-pleasing proclamations are contradictory. Anyone fearful of global warming should cheer higher gasoline prices, because much higher prices represent precisely the sort of powerful incentive needed to push consumers toward more fuel-efficient vehicles and to persuade the auto industry to produce them in large numbers. Bravo for higher prices!

And Samuelson concludes,
Americans want to stop global warming. They want to cut oil imports. They want cheaper energy. Who will tell them that they can't have it all? Not our
"leaders."


Gas Was 56% MORE Expensive in 1981 Than Today

Another factor to consider when comparing today's gas prices to previous years is the significant increase in fuel efficiency over the last 25 years. According to the EIA, average fuel efficiency in 1981 was about 15.6 miles per gallon (MPG), and now it is over 20 MPG, almost a 30% increase (see graph above, click to enlarge). The "Real Cost Per Mile" series above takes into account both the changes in inflation-adjusted gas prices and the changes in fuel efficiency over time.

Bottom Line: The real cost of gas in 1981, adjusted for inflation and fuel efficiency, was 56% MORE expensive than today.

Quote of the Day II: Political Rhetoric vs. Facts

Then there are the famous "obscene" profits of oil companies. Again, there is no definition and no criterion by which you could tell obscene profits from PG-13 profits or profits rated G.

There is not the slightest interest in how large the investments are that produced those profits. Relative to the vast investments involved, oil company profits do not begin to approach the rate of return received by someone who bought a house in California ten years ago and sells it today.

Oil company executives make big bucks incomes, almost as much as movie stars who are never criticized for "greed." And if Big Oil CEOs worked for nothing, it is unlikely to be enough to bring the price of a gallon of gas down by a nickel.

But facts are not nearly as exciting as rhetoric -- and the role of most political rhetoric is to be a substitute for facts.

~Thomas Sowell, A War of Words Part II

Quote of the Day: "Fair Trade" = Protectionism

"Fair trade" is code for protectionism disguised as retaliation against other countries that may or may not practice protectionism, and it's a bad sign when even Republicans talk about "fair" rather than "free" trade.

We should practice free trade no matter what others do, because freedom is good in itself. If foreign governments want to hurt their citizens, it's no reason for ours to hurt us.

~John Stossel

Top 5 Metro Areas for Lowest Jobless Rates

According to today's release from the BLS, therse are Top 5 Metro Areas with the lowest April unemployment rates (3 of the 5 are in Montana):

1) Billings, Montana: 1.7%
2) Logan, Utah: 1.9%
3 (tie)
Huntsville, Alabama: 2.1%
Missoula, Montana: 2.1%
5) Great Falls, Montana 2.2%

In Politics, Type II Error is Better Than Type I Error

"In all our FDA history, we are unable to find a single instance where a Congressional committee investigated the failure of FDA to approve a new drug. But the times when hearings have been held to criticize our approval of a new drug have been so frequent that we have not been able to count them. The message to FDA staff could not be clearer."

~Former FDA Commissioner Alexander Schmidt, in Walter Williams' column
FDA: Friend or Foe?

Read about Type I and Type II Error in Wikipedia.

Chart of the Day: Barriers to Entry

Here's what $600,000 taxi medallions in NYC do to the supply.

Tuesday, May 29, 2007

Wikipedia As An Example of Spontaneous Order

Jimmy Wales invented Wikipedia (it currently has 1.6 million articles in English), and he remains its reigning local deity. Despite that, Wikipedia actually happened because it was allowed to happen. Rather than specifying at the beginning what the rules would be, Wales let the community evolve its own rules, in response to real needs.

From the current issue of Wired Magazine, "Wikipedia Is Just the Start: An Interview With Jimmy Wales"

See the entry for "spontaneous order" on Wikipedia.

What's So Great About Trade Surpluses?

To those who believe a trade surplus should be the objective of policy, take a look at Japan and Germany. Both have had large and persistent trade surpluses for decades. But for the better part of the past two decades, Japan has experienced anemic economic growth. Germany, during the same period, has had mostly double-digit unemployment. Meanwhile, the United States, with its large and growing deficit, has experienced steady, consistent economic growth and job creation over the same period.

~Daniel Ikenson from Cato

NYC Taxi Medallion Sells for Record $600,000

NEW YORK: The price of a New York taxi medallion reached a record $600,000. The previous record price Medallion financed was $550,000. Prices of corporate medallions have increased from $195,000 in 2001 to the record $600,000.

According to Andrew Murstein, president of Medallion Financial Corporation, the leading lender to the industry, "Taxi medallions have been one of, if not the single best investment to own over the years. While the Dow has gone up 8% per year over the last 50 years, taxi medallions have gone up almost double that, 14% per year. They have outperformed every major index including real estate, gold and other stock indexes."

Sure, it's a taxi cartel and entry is restricted, so wouldn't you expect better performance than the return on the stock of private companies, who generally operate without entry barriers?

Top 10 Reasons to Reject Canadian Medicine in CA

1. In 1993, Canadian patients waited on average 9.3 weeks between the time they saw their family physician and the time they actually received specialist treatment. By 2006, that wait had nearly doubled to 17.8 weeks.

2. Median wait times in Canada are almost double the wait that physicians consider clinically reasonable.

3. Canadians currently wait an average of 18 weeks between the time they see their family physician and the time they receive treatment from a specialist.

4. In 2004, 25.5 MRI exams per 1000 population were performed in Canada, compared to 83.2 in the U.S.

5. In 2003, 45 in-patient surgical procedures per 1000 population were performed in Canada, compared to 88 in the U.S.

6. In 2004, Canada had 2.1 practicing physicians per 1000 population, compared to 2.4 in the United States—equivalent to 300 fewer doctors per 1 million residents.

7. In 2003, the average hospital in Ontario (Canada’s largest province) was 40 years old; the average hospital in the United States was 9 years old.

8. Canadian physicians earn only 42% as much as American physicians. Canadian nurses earn only two thirds as much as American nurses. Canada’s public monopoly exploits the services of medical labour by holding down wage rates below what they would be in the market.

9. As a result of below-market wages, thousands of Canadian-trained and previously active physicians have left Canada for better opportunities and working conditions in the United States. In 2003, more than 1.2 million Canadians were unable to find a regular family physician.

10. In Canada government spending on health care is growing faster than the ability of the government to pay for it. Public health spending will consume more than half of total revenue from all sources by the year 2020, two-thirds by the year 2035, and all of provincial revenue by 2050.

From the Fraser Institute report "California Dreaming: The Fantasy of a Canadian-Style Health Insurance Monopoly in the United States," released today as California Governor Arnold Schwarzenegger begins a three-day visit to Canada, warning the governor of the consequences of implementing a Canadian-style health insurance system in his home state.


Here is the Fraser Institutes's
press release.


Paying More Than Ever For Gas? Not Really

From an IBD editorial "Paying More Than Ever For Gas? Not If Buying Power Is Considered" by two senior fellows at Cato (see graphs above, click to enlarge):

The Bureau of Economic Analysis reveals that the percentage of personal income that Americans spend on driving has been relatively constant over time: about 10.2% since 1960.

The percentage of our personal income that we spend on fuel, however, has fluctuated a great deal more than that. When pump prices go up, people adjust by spending less on other aspects of driving, like new car purchases, automotive maintenance, new paint jobs and stereos. Over time, they'll buy more fuel-efficient cars to reduce the amount of gasoline they need to buy.

In short, consumers — not oil companies — exercise control over how much they spend to get from here to there.

Politicians Drunk on Ethanol, The State Religion

American legislators and policymakers seem oblivious to the scientific and economic realities of ethanol production. Brazil and other major sugar cane-producing nations enjoy significant advantages over the U.S. in producing ethanol, including ample agricultural land, warm climates amenable to vast plantations and on-site distilleries that can process cane immediately after harvest.

Thus, in the absence of cost-effective, domestically available sources for producing ethanol, rather than using corn, it would make far more sense to import ethanol from Brazil and other countries that can produce it efficiently — and also to remove the 54-cents-per-gallon tariff on Brazilian ethanol imports.

Our politicians may be drunk with the prospect of corn-derived ethanol, but if we don't adopt policies based on science and sound economics, it is consumers around the world who will suffer the hangover.

From an editorial in the LA Times (free subscription may be required) "Why Ethanol Backfires"

Quote of the Day

You don't need to know any economics to be in favor of "a living wage" or "affordable housing." In fact, the less economics you know, the more you can believe in such things.

~Thomas Sowell, from his commentary "A War of Words"

Interesting Facts of the Day - It Could Be Worse

Price of gasoline in India: $5.16 per gallon
Per-capita GDP: $3,737 (2006
according to IMF)
1000 gallons of gas as a percent of per-capita GDP: 138.2%

Price of gasoline in the US: $3.21 per gallon
Per-capita GDP: $43,500
1000 gallons of gas as a percent of per-capita GDP: 7.3%

Monday, May 28, 2007

Seize Property, Control Prices, Silence the Press

CARACAS (Reuters) - VRCTV was the most popular TV station in Venezuela, and has been on the airwaves for 53 years. Venezuela shut down the opposition television channel on Monday and replaced it with one promoting President Hugo Chavez's self-proclaimed socialist revolution in a move widely criticized as a threat to democracy.

In this video, you can see the sad way that the news program on RCTV shut down this past Friday, after Venezuela's president arbitrarily decided to close it.

Via
Reason and BoingBoing.

Update: Read an excellent IBD staff editorial here, "Off The Air."

It's All Relative


TEHRAN, Iran --Iran jumped gasoline prices 25% Tuesday in a new blow to consumers already disgruntled over high inflation, and the government said it will begin rationing fuel in two weeks.

The increase is part of the government's efforts to reduce state subsidies on gasoline and to discourage smugglers who have been buying fuel at Iran's relatively low price and sneaking it out of the country to sell elsewhere.

The hike, which is likely to drive up costs of transportation and put more pressure on inflation, drew quick anger.

Ready for this? The price increase in Iran was from 30 cents a gallon to 38 cents a gallon! The last time gas sold for 30 cents in the U.S. was around 1964, and the last time it was 38 cents was 1973!

Happy Memorial Day and Carpe Diem!

Quotes of the Day

1. The first CAFE standards, according to a 2002 National Research Council study, resulted in 1,300 to 2,600 more Americans killed on the roads in 1993, a typical year, because cars were lighter. If any pharmaceutical product had killed that many patients the manufacturer would be bankrupt. Families can sue Merck, but not Uncle Sam.

2. It's ironic that many politicians who accuse Americans of using too much gasoline want to hold hearings on price gouging when prices rise to reflect hurricanes in the Gulf of Mexico or turbulence in the Middle East. Price increases will eventually lead to less consumption.

~From Diana Furchtgott-Roth's
commentary in the New York Sun.

Greg Mankiw's Excellent Explanation

If Congress proposed to raise our taxes, and use the tax revenues to purchase lots of Chinese treasury bonds, China would certainly enjoy lower interest rates, but wouldn't most Americans object to this proposal? Of course. But then why do we object when China does basically the same thing, and helps finance investment in the U.S. economy? We might object because it possibly makes the Chinese worse off, but nobody makes that argument.

Read Greg Mankiw's excellent explanation of why the current account deficit and capital account surplus with China is not a big deal. "While some jobs are lost to import competition, other jobs are gained because of lower interest rates and greater investment spending that capital inflows finance."

Note: We get a $200 billion capital inflow annually from China.

Sunday, May 27, 2007

U-Haul Update

I have posted several times about U-Haul rates for one-way truck rentals reflect supply and demand, relative moving patterns due to relative economic conditions, etc. Michigan currently has the highest unemployment rate in the country of 7.1% for April, and Michigan has been losing jobs since 2000. Michigan's job-loss streak hit six years in 2006, a string unprecedented since World War II. Over the past six years, Michigan's economy has lost a total of 308,900 jobs. The state's manufacturing workforce has declined by about 25 percent during this time.

As might be expected, there are a lot more people moving OUT of Michigan than moving INTO Michigan, and that is reflected in the following current
quotes from U-Haul for one-way rentals of a 26-foot truck in June:

Ann Arbor, Michigan to Atlanta: $1925
Atlanta to Ann Arbor, Michigan: $556

Ann Arbor, Michigan to Birmingham, AL: $1481
Birhmingham, AL to Ann Arbor, Michigan: $642

Ann Arbor, Michigan to Salt Lake City: $2048
Salt Lake City to Ann Arbor, Michigan: $989

Forget OPEC, What About The Taxi Cartels?


George Will explains in today's Washington Post what an immigrant can teach Americans about capitalism, rent-seeking and democracy, as taxi driver Luis Paucar tackles a twisted sense of entitlement in Minneapolis.

MINNEAPOLIS -- The campaign to deny Luis Paucar his right to economic liberty illustrates the ingenuity people will invest in concocting perverse arguments for novel entitlements. This city's taxi cartel is offering an audacious new rationalization for corporate welfare, asserting a right -- a constitutional right, in perpetuity -- to revenues it would have received if Minneapolis' City Council had not ended the cartel that never should have existed.

Paucar, 37, embodies the best qualities of American immigrants. He is a splendidly self-sufficient entrepreneur. And he is wielding American principles against some Americans who, in their decadent addiction to government assistance, are trying to litigate themselves to prosperity at the expense of Paucar and the public.

Read the rest of the article here, George Will deserves another Pulitzer Prize for this one.

The Institute for Justice (IJ) is representing Luis Paucar, and filed documents in U.S. Federal Court to join with the city of Minneapolis to defend the city’s free-market reforms that removed a cap on the number of taxis allowed to operate within city limits, read more about it here.

The Minnesota chapter of IJ already has four economic liberty victories under its belt despite being just two years old. The group recently published a 21-page paper titled "
The Land Of 10,000 Lakes Drowns Entrepreneurs in Regulations," which exposed the shocking state of economic liberty in Minnesota, including the taxi industry in Minneapolis.

For a chart of average NYC taxi medallion prices over time through 2006
click here, and for 2007 prices click here ($418,000 to $550,000 PER medallion, for ONE taxi license).

Saturday, May 26, 2007

Quote of the Day

Wardens and guards can't keep drugs out of our federal prisons, yet there are those who want to turn this country into a prison in an attempt to eliminate drugs.

~From The Casualties of War, a speech by Sharon Harris

Stronger the Drug Laws, The Stronger the Drugs

According to a study by the Office of National Drug Control Policy, cocaine prices (adjusted for inflation) fell by more than 80% between 1981 and 2003, while the average purity almost doubled from 40% to 70% during that period (see graph above, click to enlarge). The data in the graph are for amounts of powdered cocaine less than 2 grams, the report also has price and purity for larger amounts, as well as price/purity data for heroin, crack cocaine, meth and marijuana, for those data go here.

Bottom Line: We spend about $50 billion per year on the War on Drugs, and arrest about 1.7 million Americans every year for drug violations, and yet drugs get cheaper and stronger over time??

Check the Drug War Clock here, to see the amount spent so far this year at the federal and state level, and the number of arrests.

See Slate Magazine's article "How Much for All That Heroin? The Art and Science of the DEA's Drug Valuations," which is where I found the link to the drug study and data.

Friday, May 25, 2007

Two Americas: Public vs. Private Sector Empoyees

From today's Detroit News: According to the Michigan Department of Labor and Economic Growth the average pay in 2006 for state government employees was $49,660. For private-sector workers, the comparable figure was $42,588. That's a difference of close to 17 percent.

And state employees often receive more generous health and retirement benefits than private sector employees. While new state employees receive 401(k)-type retirement contributions, older employees still receive pensions. Michigan civil service employees receive benefits equal on average to 54% of base payroll; nationally, private sector workers on average receive benefits equal to 41% of base payroll.


The Detroit News cites a Mackinac Center study "What Price Government?" that details higher salaries for public sector jobs compared to comparable private sector jobs.

Yes, there are Two Americas in Michigan: One for those work for the government and another for those in the private sector.

Taxes, Revenues, Globlization and Prosperity

Excerpts below from today's WSJ, an editorial about the OECD's study "Making the Most of Globalization," released yesterday.

Over the past decade, most OECD countries cut corporate taxes, some by a great chunk, and saw average state revenues go up -- not just in absolute terms. As the chart above shows, corporate-tax proceeds have also risen as a percentage of GDP.

By scrapping tax exemptions and lowering headline rates, governments have attracted investment, boosted growth and corporate profits, and improved tax compliance. It's a nice demonstration of the Laffer curve at work.

The study also disproves the mercantilist claim that world trade is a zero-sum game. Living standards rise when trade barriers fall. The OECD found that a 10 percentage-point increase in trade exposure -- the rise in exports and imports as a share of GDP -- has led to a 4% rise in income per capita.

Also contrary to protectionist arguments, trade openness doesn't hurt overall employment. Offshoring may reduce the workforce of individual firms in their home country. But for the national economy, the improved competitive position and higher productivity lead to greater demand for labor. As a result, structural unemployment in the EU fell one percentage point over the past decade even though Europe has made little progress in easing labor market rules, the OECD says.

Income Inequality: Generation Gap

A previous post discusses how the "marriage gap" might contribute to increasing income inequality. Another explanation of income inequality is offered by USA Today - it's a "generation gap":

The growing divide between the rich and poor in America is more of a generation gap than class conflict, according to an analysis of federal government data. The rich are getting richer, but what's received little attention is who these rich people are. Overwhelmingly, they're older folks. The graying of wealth and income may be the most important twist in the new inequality.

Nearly all additional wealth created in the USA since 1989 has gone to people 55 and older, according to Federal Reserve data. Wealth has doubled since 1989 in households headed by older Americans, and people 35 to 50 actually have lost wealth since 1989 after adjusting for inflation.

The net worth of households headed by a college-educated person ages 55-59 rose to $526,300 in 2004, up from $271,515 in 1989, adjusted for inflation. This group has enjoyed enormous income gains, too, and had a median annual income of $100,634 in 2004.

Bottom Line: Income typically peaks at age 57 and wealth at age 63, according to the Federal Reserve. Therefore it may not be so much that "the rich are getting richer and the poor are getting poorer," as much as it is that as the older baby boom generation enters their peak years of earnings and wealth, the older baby boom generation (especially the college graduates) is getting richer. Ergo a generation gap contributes to income inequality.

Oil Facts

Percentage of domestic oil resources currently off-limits in ANWR and the Outer Continental Shelf : 78

Amount of Domestic oil currently off-limits: 131 billion barrels

Oil imported annually from the Persian Gulf: About 1 billion barrels

Oil imported annually: About 5 billion barrels

Oil consumed annually in the US: About 7 billion barrels

Oil produced annually in the US: About 2 billion barrels

Number of years that domestic oil in the OCS could substitute for Persian Gulf imports: 60

Number of years that domestic oil in ANWR could substitute for Saudi imports: 25


(Data above are from an IBD editorial, the Energy Information Administration, and the American Petroleum Institute.)

What Tax Cut?

According to the CBO, total federal revenues grew by $625 billion, or 35%, between fiscal year 2003 and fiscal year 2006. Tax revenues as a percent of GDP have increased from 16.5% in 2003 to 18.4% in 2006 (see chart above, click to enlarge).

Via Taxing Tennessee.

One Source of Income Inequality? The Marriage Gap


There has been a dramatic rise in illegitimacy and divorce during the last forty years (see charts above), and it has been largely limited to less educated men and women. As the divorce rate plummets at the top for the college-educated and rises at the bottom for those with less than a high school degree, there is a widening “marriage gap” in the U.S. that contributes to the observed income inequality over time.

That is the premise of Kay Hymowitz in her book "Marriage and Caste in America: Separate and Unequal Families in a Post-Marital Age," which is mentioned in The Economist article "Marriage in America: The Frayed Knot." Excerpt:

There is a widening gulf between how the best- and least-educated Americans approach marriage and child-rearing. Only 4% of the children of mothers with college degrees are born out of wedlock. And the divorce rate among college-educated women has plummeted.


At the bottom of the education scale, the picture is reversed. Among high-school dropouts, the divorce rate rose from 38% for those who first married in 1975-79 to 46% for those who first married in 1990-94. Among those with a high school diploma but no college, it rose from 35% to 38% (see chart above).

And these figures are only part of the story. Many mothers avoid divorce by never marrying in the first place. The out-of-wedlock birth rate among women who drop out of high school is 15%. Among African-Americans, it is a staggering 67%.

Bottom Line: It's not so much that the "rich are getting richer and the poor are getting poorer," as much as it's "those going to college and staying married are doing increasing well over time, and single-parents without a high school degree are not doing so well over time."

Thursday, May 24, 2007

Is Gas At An All-Time High? Not Even Close

According to the Energy Information Admininstration (EIA), the highest average monthly gas price in the early 1980s was $1.417 per gallon in March of 1981, which in today's dollars is $3.22 per gallon, which also according to the EIA is the average retail cost of gas today.

However, gas prices as a percent of income are still way below the early 1980s. In both 1980 and 1981, 1000 gallons of gas at the average price cost 14.1% of per-capita disposable personal income in those years. Gas prices averaged $1.245 and $1.38 in 1980 and 1981 respectively, and per-capita income was $8,822 and $9,765 in those years (see chart above, click to enlarge; source for Personal Income is Bureau of Economic Analysis, Table 2).

Gas is now selling for an average of $3.22 and per-capita disposable personal income in March was about $33,000, so that 1000 gallons of gas now costs 9.76% of per-capita personal disposable income (see chart above, click to enlarge).

Bottom Line: Gas is still much cheaper today as a percent of income compared to 1980 or 1981. To be as expensive as gas was in 1980-1981 gas (as a percent of income), prices today would have to get all the way up to $4.62 per gallon.

Reason: Gas prices have increased about 2.5X since 1980-81, but per-capita personal disposable income has increased by about 3.5X during that same period.

Who Would Object to Affordable Health Care?

From Gallup: "Healthcare costs are among the top financial problems facing American families, and healthcare is listed as one of the top economic problems for the country. Healthcare costs are volunteered as the top specific health problem facing the country, above and beyond diseases such as cancer."

And what is the proftit-seeking private sector doing about healthcare reform and healthcare costs?

From the Financial Times: Walk-in clinics represent one of the most advanced and aggressive attempts by US business and entrepreneurs to drive reform of the healthcare system.

This year hundreds will be opened in some of the US’s largest drugstore and retail groups, and thousands of clinics could be running in the next decade. In May, Walgreens bought Take Care, following CVS’s MinuteClinic acquisition last year. Both Wal-Mart and Target, the leading discounters, are opening walk-in clinics.

Advocates say the clinics will improve access to healthcare and reduce costs; that they will reduce more expensive visits to hospital emergency rooms; and that they will catch some illnesses before they become serious and costly. As a result, physicians will have more time for complex cases.

Sounds good, right? As important as healthcare and healthcare costs are to Americans, and as much as we hear about the need for reform, who would possibly object to greater accessibility to low-cost basic health care at a Target, Walgreens or Wal-Mart?

You can probably guess, but
find out here.

Interesting Fact of the Day

Number of cars per 1000 people (from an IHT article):

Western Europe: 500
United States: 450
India: 7

Isn't it interesting that Europe has 11% more cars per person than the U.S., which seems to contradict the notion that massive taxpayer-financed investments in public transportation and $5 per gallon gasoline taxes will cut down on automobile dependence? Certainly the cars in Europe are smaller and more fuel-efficient, but it still seems surprising that Europeans own more cars than Americans.

And watch out for India. From the IHT article, "India's 216 million-member middle class is rushing to make up for decades of automotive deprivation. In the last year, Indian passenger car sales climbed 21% to 1.38 million. By 2015, they are expected to almost triple to three million."

Cartoons of the Day

I have some bad news and some good news Miguel....Remember stagflation?

Four States Set Record Low Jobless Rates in April

State unemployment rates for April were released last week by the BLS, and there are now 18 states that have set historical record-low jobless rates in the last year, and 12 of those states set record-low rates this year. Alabama, Alaska, Texas and Washington set records in April 2007.

Here are the 18 states with historical record-low jobless rates since July 2006:

Alabama: 3.3% in April 2007
Alaska: 5.8% in April 2007
Arizona: 3.9% in March 2007
California: 4.7% in November 2006
Florida: 3.2% in October 2006
Hawaii: 2.0% in December 2006
Idaho: 2.8% in March 2007
Illinois: 4.0% in November 2006
Louisiana: 3.3% in July 2006
Montana: 2.0% in March 2007
Nevada: 4.1% in May 2006
New Mexico: 3.5% in February 2007
New York: 4.0% in March 2007
Pennsylvania: 3.8% in March 2007
Texas: 4.2% in April 2007
Utah: 2.3% in February 2007
Washington: 4.4% in April 2007
W. Virginia: 4.0% in January 2007

Wednesday, May 23, 2007

Dueling Fools on Housing: Good or Bad Investment?

One Motley Fool contributor argues that buying a home is "The Best Investment Ever."

Another Motley Fool contributor argues that a house is "The Worst Investment Ever," (via Society and Money blog).

Using quarterly "House Price Index" data from the Office of Federal Housing Enterprise Oversight (OFHEO), the chart above compares the S&P 500 Index to the House Price Index for the U.S. and for the state of California from 1975-2006.

Average annual return for owning a home: 6.08%
Average annual return for owning S&P500: 9.32%

Gasoline Taxes vs. Profits

After crude oil costs, gasoline taxes are the second largest contributor to the price paid at the pump. Together Federal and State excise taxes on fuel account for an average cost of approximately 62 cents per gallon. That's a combined tax of about 20% per gallon of gas.

The federal tax per gallon is 18.4 cents per gallon,
see the history of federal gasoline taxes here, and the state tax per gallon varies by state, see the complete list of state gasoline taxes here.

Average profit per gallon of gas for oil companies: 10 cents according to the EIA.

Quote: The government collects far more in taxes on every gallon of gasoline than the oil companies collect in profits. If oil company profits are "obscene," as some politicians claim, are the government's taxes PG-13?

~Thomas Sowell

Chart of the Day

Fact: In the last five years, the U.S. money supply (M1) has increased by about 19% and the value of the U.S. dollar (Trade Weighted Exchange Index: Broad) has decreased by about 19%.


Tuesday, May 22, 2007

Bad News for 2 Americas Myth: The Poor Got Richer

Some bad news today for John Edwards and his "two Americas" campaign theme.

Today's WSJ reports on a new study just released by the Congressional Budget Office that shows that the poor have been making significant earnings gains, due to a combination of welfare reform, expansion of the earned income tax credit and wage gains from a tight labor market, especially during the 1990s expansion.

The CBO reports that low-wage households with children had earnings after inflation in 2005 that were about 80% higher than in the early 1990s. From the WSJ:

The CBO results don't fit the prevailing media stereotype of the U.S. economy as a richer take all affair -- which may explain why you haven't read about them. Among all families with children, the poorest fifth had the fastest overall earnings growth over the 15 years measured(see the chart above). The poorest even had higher earnings growth than the richest 20%. The earnings of these poor households are about 80% higher today than in the early 1990s.

The report also rebuts the claim that the middle class is losing ground. The median family with children saw an 18% rise in earnings from the early 1990s through 2005. That's $8,500 more purchasing power after inflation. The wealthiest fifth made a 55% gain in earnings, but the key point is that every class saw significant gains in income.

There's a lot of income mobility in America, so comparing poor families today with the poor families of 10 years ago can be misleading because they're not the same families. Every year hundreds of thousands of new immigrants and the young enter the workforce at "poor" income levels. But the CBO study found that, with the exception of chronically poor families who have no breadwinner, low-income job holders are climbing the income ladder.

Life Expectancy 1000-1999


The chart above (click to enlarge) shows life expectancy at birth from 1000-1999, taken from "The World Economy," by Angus Maddison, published by the OECD.

Group A includes Western Europe, U.S., Canada, Australia, New Zealand, and Japan. Group B includes Africa, Asia, Eastern Europe and Latin America.

Note that a) life expectancy more than doubled during the 20th century, b) life expectancy remained basically the same from 1000 to 1800, and c) more gains were made in the last 100 century than all previous centuries combined.

Wal-Mart Gets the Gold Medal For Employee Safety

In a comment about my post Wal-Mart Gets Gold Medal for Pleasing Consumers, Walt G. says "You don’t have to take my word about Wal-Mart’s and Sam’s Club safety records, go here to the OSHA website and type in Wal-Mart or Sam’s Club to see for yourself, they get the Lead Medal for employee safety."

I did go to the Department of Labor's website for OSHA enforcement inspections over the last 5 years and typed in Wal-Mart, Target and Home Depot and obtained these results: 535, 242, and 326 for those 3 employers. I also obtained the number of employees per company using Yahoo Finance (1.9 million, 352,000 and 247,520), and then calcuatled the number of OSHA inspections per 100,000 employees at each company, and those calculations are displayed above in the graph.

As you can see, Target has almost 2.5 X as many OSHA inspections as Wal-Mart, and Home Depot has almost 5 times as many OSHA inspection.

Conclusion: Wal-Mart has a much better safety record than either Target or Home Depot, measured by inspections per employee, and therefore gets the Gold Medal for employee safety, not the Lead Medal.

(Update: Graph has been revised to include GM in response to Walt G.'s comments, Wal-Mart still gets the Gold!).

Stop Fixating on the Fixed Dollar-Yuan Peg

From today's WSJ, an excellent op-ed by Dartmouth professor Matt Slaughter ("Yuan Worries") about the misplaced concern and misgivings that the "unfairly" low value of the dollar-yuan peg is causing our massive trade "imbalance" with China ($232 billion in 2006). Professor Slaughter makes several excellent points:

1. The yuan floats against European currencies such as the euro and the pound but has been fixed against the dollar (see chart above). If nominal exchange rates were driving trade flows as commonly alleged, then Chinese exports to the U.S. should have been growing faster than to Europe. The data show something completely different, however. In 1995, monthly Chinese exports to both destinations averaged about $2 billion. By 2006, monthly Chinese exports to both destinations were still the same, at about $17 billion. Plotted together over that entire decade, these two series look nearly identical. This is because the same real economic forces -- e.g., China's relative abundance of less-skilled labor -- have been driving both sets of trade flows.

MP: And NOT the currency values, emphasis added. In other words, if China had allowed the yuan to float against the dollar in the past, the U.S. would still have a large trade deficit with China today, because real economic forces of comparative advantage drive trade flows, not nominal prices or ex-rates.

2. Many central banks today use their sovereign power to fix a nominal short-term interest rate rather than a nominal exchange rate. The U.S. Federal Reserve targets the federal-funds rate; the European Central Bank targets the main refinancing operations rate; and the Bank of Japan targets the overnight call rate. But exchange-rate targets are by no means uncommon. Indeed, in 2005, 55.6% of the world's countries fixed their exchange rates (see chart above for the Hong Kong dollar, which is pegged to the USD). And many countries have switched their targets over time. From 1945 to 1971, for example, the Federal Reserve targeted the value of the dollar at $35 per ounce of gold.

In other words, all central banks peg, fix or target something: the U.S. Fed targets interest rates (Fed Funds rate), but used to target the money supply, many central banks have an inflation target (Canada, New Zealand, Australia), and many countries have an ex-rate target (e.g. see the pegged Hong Kong dollar in the chart above). Referring to China's policy of pegging the value of the Yuan as "currency manipulation" or "unfair" would like calling the Fed's current monetary policy unfair "interest-rate manipulation." Notice also that nobody ever complains about the hundreds of countries like Hong Kong that also target or peg their ex-rate.

3. Professor Slaughter furthers explains why it might sense for China to target its ex-rate instead of its interest rates: Chinese capital markets today lack many of the microeconomic institutions that transmit changes in short-term interest rates into the broader economy: e.g., a primary-dealer market in government debt securities and, more generally, a deep network of investment and commercial banks allocating credit guided by risk-adjusted returns. This may well be one reason the PBOC maintains its exchange-rate target: An interest-rate target might weaken its linkages to the real economy.

In other words, it makes more sense for an advanced economy like the U.S. with advanced credit markets to target ("manipulate") interest rates than a developing economy like China without advanced credit markets.


Wal-Mart Gets Gold Medal for Pleasing Consumers

As America's (and the world's) premier entrepreneurial organization, Wal-Mart is engaged in an ongoing process of innovation, experimentation, trial-and-error, "continuous improvement" and discovery, always with the ultimate goal of trying to figure out how to best serve and please consumers. No organization in history has probably better exlempified the concept economists call "consumer sovereignty" than Wal-Mart - consumers are the kings and queens in Wal-Mart's world. And hey, it's not always an easy job figuring out how to best please consumers, whose tastes and preferences are subjective, fickle and ever-changing.

A few recent examples of Wal-Mart's ongoing innovation:

1. From today's WSJ an article "Slow Sales of Designer Line Show Higher-End Clothes Remain a Weak Spot" discusses Wal-Mart's worsening struggles in fashion apparel - a Wal-Mart experiment into higher-end clothing that apparently isn't working so well, which is why it's called "trial" and "error."

2. After being denied entry into the banking industry by federal regulators, Wal-Mart announced last week that it has teamed with discount brokerage ShareBuilder Corp. to offer low-cost investment services, marking the retailer's initial expansion of its financial-services offerings, read the WSJ article here. Wal-Mart is aggressively expanding its financial-services business, which already includes selling money orders, bill payment and check-cashing services.

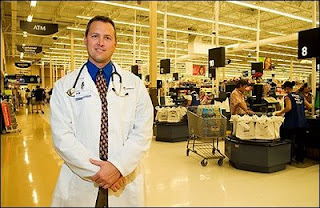
3. Wal-Mart will contract with local hospitals and other organizations to open as many as 400 in-store health clinics over the next several years, and up to 2,000 health clinics in Wal-Mart stores over the next five to seven years.

4. Wal-Mart customers have saved $300 million on selected generic prescription drugs since 2006, when the company began selling prescriptions for $4 nationwide. The $4 prescriptions now account for 35% of all prescriptions filled at Wal-Mart, and 30% of the $4 prescriptions are filled without insurance.

When it comes to innovation directed toward consumer sovereignty, Wal-Mart gets the Gold Medal.