CARPE DIEM
Professor Mark J. Perry's Blog for Economics and Finance
Friday, August 31, 2007
Thursday, August 30, 2007
Buy Houses in Detroit for $1500, Monthly Pmt. = $7

That is, more than 15% of the homes for sale in Detroit, or almost 1 out every 7 homes for sale, is priced at $20,000 or less, including the "Great Investment Property" pictured above, which is listed at a $1,500 sales price (negotiable?) with estimated monthly payments of only "$7 per month."
"$7 for a monthly house payment," isn't that about what a single pack of cigarettes cost now?
Energizer Bunny Economy
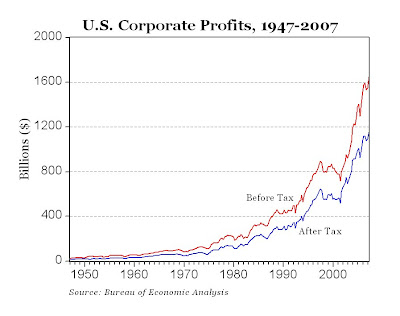 The Commerce Department reported today that corporate profits strengthened in the second quarter, and hit an all-time high of $1.646 trillion on a before tax basis and $1.154 trillion after taxes (see chart above). Profits after taxes grew by 5.4% in the second quarter, after rising by 1.5% in the first quarter. Year over year, corporate profits increased by 3.5%.
Another way to put U.S. corporate profits of $1.646 trillion in perspective is to compare it to world GDP figures. If the $1.646 trillion of profits generated by American businesses were considered to be a "country," the corporate sector of America would be the 8th largest country in the world, just slightly behind Italy, and larger than the entire economies of Canada, Spain, Brazil, Russia, and about twice the size of the entire economies of S. Korea, Mexico, India and Australia!

Wednesday, August 29, 2007
Globalization: India's Tata Motors May Buy Jaguar

 India's Tata Motors (NYSE:TTM) apparently wants to cover both ends of the vehicle market, and might soon be selling both the world's least expensive and the world's most expensive cars.
 In India, Tata Motors will introduce a new 4-door "1-lakh car" early next year, which is half the price of the lowest-priced cars on India's roads today and will be the cheapest car in the world. "1-lakh" rupees is 100,000 rupees, which is about $2,400 at the current exchange rate of 41 rupees per USD.
Washington Post: The cheapest car in the world is being released during a time of good fortune for many Indians. While two-thirds of the country's population still struggles on $1 a day, millions of people here have emerged from grinding poverty into the lower middle class. The Asian subcontinent's largely service-based economy has been growing 8 to 9 percent a year, and World Bank studies estimate that India's middle class will expand from 50 million people today to more than 500 million by 2025.
Typical buyers of the 1-lakh car would include the millions of Indians who currently have a motorcycle or moped as the "family vehicle" (see the picture above; look closely and you'll see two adults and 4 children on one motorcycle!).
On the other end of the vehicle market, Tata wants to buy Ford's luxury brands Jaguar (pictured above is the new 2009 Jaguar XF, availabe in June 2008) and Land Rover.
Wall Street Journal: The acquisition, which could cost more than $1 billion, also would fit the Tata Group's plans to become one of India's first global brands and diversify its businesses overseas.
It is unlikely that Tata Motors will be able to sell many Jaguars or Land Rovers in India, but it could use the companies' technology and production facilities to improve its own cars and trucks. Tata Motors also would seek to use Jaguar's and Land Rover's international distribution networks to promote its own cars abroad.
The steel-to-software Tata Group is one of India's largest and most respected conglomerates. Its 96 companies employ about 200,000 people and have annual sales of more than $20 billion. The group has been leading a wave of Indian overseas investment as local companies have used the wealth generated in India's strong domestic economy to make acquisitions around the world.
Bottom Line: As India grows and prospers, and as its middle class increases by 5 times over the next several decades, India's consumers and companies will increasingly shop and invest globally, to the benefit of many U.S. companies.
Tuesday, August 28, 2007
Carpe Diem on CNBC's Kudlow and Company
 Carpe Diem got a mention yesterday (Monday, August 27) on CNBC's Kudlow and Company, showing the graph from this recent CD post about subprime mortgages. You can view the 12-minute segment here titled "Market Drilldown (right hand side), Carpe Diem gets discussed at about 8:40. Check it out!!
 Overwhelming Evidence III: Good Old Days Are Now
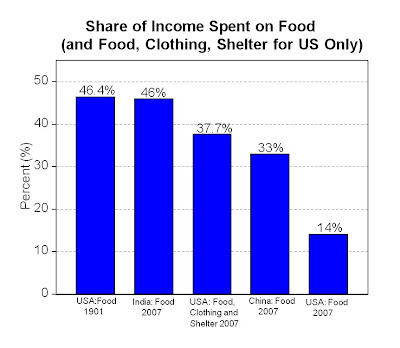
By comparison, The Economist today reports that the typical household in India today spends 46% of its income on just food, which is more than the typical American household spends on food AND clothing AND shelter (as a share of income)! And the average Chinese household spends almost as much on food (33%) as the average American household spends on food, clothing and shelter.
Monday, August 27, 2007
Housing Inventories Up, Housing Sales Down

 WASHINGTON -- Existing-home sales fell a fifth straight time during July (see top graph), while inventories of unsold property climbed (see bottom graph) and prices dropped.
Home resales declined to a 5.75 million annual rate, a 0.2% decrease from June's revised 5.76 million annual pace, the National Association of Realtors said Monday. June's rate was originally estimated at 5.75 million.
The median home price was $228,900 in July, down 0.6% from $230,200 in July 2006. The median price in June this year was $229,200.
MP: There are currently 4.592 million homes for sale, which is 731,000 more than July 2006 (3.861 million) and twice as many for sale as 3 years ago (2.244 million in 2004). During the 2004-2007 period, the sales pace of existing homes has slowed by more than 15% from 6.778 million in 2004 vs. 5.75 million in July 2007. When you combine slowing housing sales with a growing inventory of homes for sale, you get more than a doubling of the "months supply of homes at the current sales rate," from 4.3 months in 2004 to 9.6 months in July 2007.
Irrational Restaurant Behavior?
Imagine that you're getting ready to go out to a restaurant with friends, and you're trying to decide whether to eat Mexican food or Thai food. To help make your decision, would you ever think of calling a phone number at random and asking a complete stranger for his or her advice on Mexican vs. Thai food? Probably not.
But once they get to a restaurant and are deciding on what to eat, why do many people frequently do almost the same thing: ask a complete stranger (the waiter or waitress) for his/her advice on what YOU should eat?
I have several good friends who can NEVER make a decision at a restaurant without asking a complete stranger (waiter or waitress) for help. Sometimes they will ask for general advice - "what's good here?" and other times they will narrow it down to Entree A and Entree B, and ask the server "which one do you recommend - A or B?"
This behavior seems completely irrational to me - why would you think that a complete stranger would have any relevant information about whether YOU would like walleye that evening instead of a steak? What you are really asking is what the SERVER would select if they were ordering their own meal, but why would you order something just because a complete stranger would order it? Just because a stranger prefers walleye over steak on a given evening doesn't mean that you will too.
Perhaps not quite so irrational is a line of questioning that goes something like this: "What entrees do people order the most of here?" " What feedback have you gotten from other customer on Entree X?" "Have you gotten any bad reports on Seafood Entree A tonight?" At least in those cases, you are trying to get feedback from a sample size of potentially many current and past diners, and not feedback from a sample size of N=1 (the server).
My thinking is that if I'm having a hard time deciding on what to eat, knowing intimately my subjective taste patterns, my likes and dislikes, my food choices over the last week that might affect my current choice of cuisine, etc., there is no information of value that I can get from a complete stranger that will help me order my food.
It is true that waiters and waitresses might have some inside information on some occassions that might help me decide, but I strongly object to irrational behavior (in my opinion) of people who constantly put value on the opinions of complete strangers when ordering food. In general, if you wouldn't pick a random name from the phone book and ask for advice on what you should eat or where you should eat, you should't ask a server for his or her advice on your food choice.
Possible Solutions: 1) Ask you friends or spouse for food advice, they have more relevant information than a complete stranger, or 2) flip a coin to decide between Entree A and B, or 3) order a number of dishes to share, this works especially well at a Thai restaurant.
Comments welcome.
Decision-Making: Private vs. Public Sector
 Suppose a private company had an opportunity to save $100 million annually by switching to a lower cost input without adversely affecting the quality of the final product. The switch would typically happen without hesitation. That's the definition of a "no-brainer."
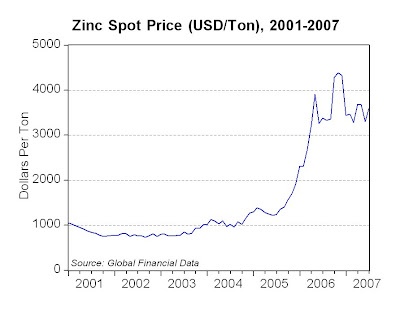
Suppose a government has an opportunity to save taxpayers $100 million annually by making coins (like pennies) with low-priced steel instead of making those coins with high-priced zinc (currently about 5 times the cost of steel), following Canada, U.K. and Europe, which have all made the switch to steel for their coins. The U.S. government deliberates what should be a "no-brainer," and takes no action. I guess that's called "politics" or maybe "no brains."
According to a Forbes article, "With the price of zinc soaring amid a worldwide commodities boom (up +400% since 2003, see chart above), it costs the government almost 2 cents to make each 1-cent coin - a pretty penny considering roughly 8 billion new ones are placed into circulation annually."
Now, who would you predict is most aggressively resisting the switch from zinc to steel for making pennies, saving taxpayers $100 million every year? As Walter Williams would say, if your answer is "the company that supplies zinc to the U.S. government for making pennies," you can go to the head of the class.
And that company is the Jarden Corporation (NYSE:JAH), whose stock has done quite well lately, much better than the rest of the market over the last 5 years, see chart below of Jarden (blue) vs. the S&P500 (red).
Another perfect example of how a well-organized, special interest group engages in lobbying and "rent-seeking" to hijack the political process in its favor, at the expense of the "rationally ignorant" voters/taxpayers. As H.L. Mencken pointed out, it's like "two foxes (the zinc lobby and Congress) and a chicken (voters/taxpayers) taking a vote on what to eat for lunch."
Sunday, August 26, 2007
Top 10 Best, Top 10 Worst Liveable Cities
 From The Economist: With low crime, little threat from instability or terrorism and a highly developed transport and communications infrastructure, Canada and Australia are home to the most liveable destinations in the world. Four of the ten most liveable cities surveyed by the Economist Intelligence Unit are in Australia, and two of the top five are Canadian. Vancouver is the most attractive destination, with a liveability index of just 1.3% (see table above, click to enlarge).
World-Class Kenyans, World-Class Competition

Saturday, August 25, 2007
Chart of the Day: World Stock Market Capitalization
 The chart above (click to enlarge) shows the total capitalization of the world's stock markets, measured in trillions of US dollars, from Global Financial Data.
 During the 19-year period between 1980 and 1999, there was increase in world stock market value of $32.25 trillion, to about $35 trillion. In just the 5-year period between 2002 and 2007, there has been an increase in world stock market value of almost $35 trillion.
Good News: Mortgage Rates Remain Low and Stable

As soft as the real estate market is right now, imagine what it would be like if mortgage rates were the average of 9.22% instead of 6.52%!
Hong Kong Harbor

Friday, August 24, 2007
Raman Roy: The Father of Indian Outsourcing

Raman Roy (pictured above) has been referred to as the "father of Indian outsourcing," "one of the pioneers of the Business Process Outsourcing (BPO) industry in India," and "the father of India BPOs." In terms of his impact on the global economy, Raman Roy probably ranks in importance with figures like Bill Gates. Check him out here:
Wharton School (UPenn) interview with Raman Roy.
Wikipedia listing for Raman Roy.
CBS "60 Minutes" transcript of "Out of India" featuring Raman Roy's famous quote "Geography is history, Morley (Safer), distances don't matter anymore."
Forbes story on "The Father of Indian Outsourcing."
Exciting opportunity: Raman Roy is speaking to the Detroit Economic Club on Wednesday, September 12 in Birmingham, Michigan, on the topic "Harnessing Global Intellectual Capital to Create Corporate Value." I will be taking a group of University of Michigan-Flint students to the luncheon, free of charge (thanks to a corporate sponsor), and we will meet with Raman Roy before the luncheon in a private reception for students only. If you are a UM-Flint student and interested, please send me an email at your earliest convenience, this is an incredible opportunity and I'll do my best to accommodate as many students as possible, on a first-come, first-served basis!
Finnish Companies Outsource to India, Too
 (CHENNAI) - The global-giant handset-maker Nokia (NYSE:NOK) plans to make its Chennai manufacturing plant a major nerve center. Nokia said it plans to make its manufacturing plant in India, now the second-largest market for its handsets, a global hub for exports. Nokia already exports to 58 countries from the India plant, and it is looking at the Chennai as a global plant for global operations.
 The world's largest handset maker by volume also said India has already over taken the U.S. to emerge as the largest market for Nokia handsets after China.
India's mobile market is one of the fastest growing in the world, fueled by low tariffs and rising middle-class incomes.
MP: Note that India has now surpassed the U.S. in cell phone sales, at least for #1 Nokia, and is second only to China globally. Just like the "baby boom generation" in the U.S. had a major impact as it matured and moved through the U.S. economy, the emerging "middle class boom" in India and China will have a major impact on the global economy as it grows and matures.
Quote: "The baby boomers are the rat that the snake swallowed. Through sheer numerical power, as it goes through the economy, the rat changes everything. If you have this big cohort, it changes all the institutions it goes through."
Like the baby boomers in the U.S., the emerging middle classes in India and China will be the rats that change everything.
Cut Tax Rates, Increase Tax Revenues From High-Income Groups; Isn't That a "Tax Hike for the Rich?"
The Shrinking Budget Deficit:

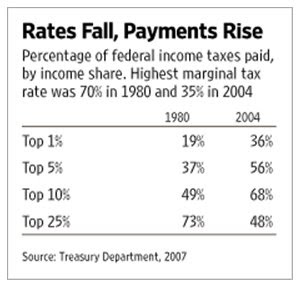 From today's WSJ editorial:
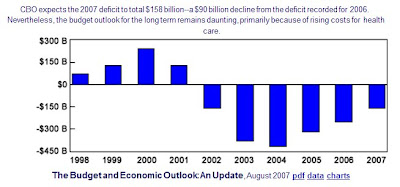
The Congressional Budget Office reported yesterday that the famously fearsome budget deficit is plummeting almost as fast as Congress's approval ratings (see top chart above, click to enlarge). The deficit this fiscal year is expected to be $158 billion, a meager 1.2% of GDP. Since the Bush tax cuts of 2003, the budget deficit has fallen by $217 billion mostly because of a continuing torrid pace of revenue growth.
With a few exceptions, tax rates in America have been steadily falling for the past 25 years starting with the Reagan tax cuts of 1981. When Ronald Reagan entered the Oval Office in 1981, the highest tax rates on income, capital gains and dividends were roughly twice as high as today. The top marginal income tax rate in 1981, for example, was 70% compared to 35% today. These tax rate reductions haven't meant that the rich have escaped paying their "fair share" of taxes or that the burden has shifted to the middle class. The opposite has occurred. Over the past 25 years tax payments by the wealthy have continually risen almost in inverse proportion to the tax rates, as shown by the surprising results in the bottom chart above.
The supply-side revenue effects on the rich are remarkable: Tax rates on higher incomes have been halved, but the federal tax share of the top 1% has nearly doubled. And the budget deficit has fallen. That's what happens when tax policy gets the incentives right.
More Affirmative Action: Fewer Black Attorneys and Fewer Black College Grads

Not surprisingly, such a gap leads to problems. Students who attend schools where their academic credentials are substantially below those of their fellow students tend to perform poorly.
A black student with a 3.2 high school GPA and 1210 SAT score has a 92% of admission to UM vs. only a 14% for a white student. However, 1) black students (45%) are almost 6 times as likely as white students (8%) to be on academic probation at UM, and 2) and almost 2/3 of black students (64%) fail to graduate nationally in 6 years, vs. 42% for white students.
Bottom Line: Eliminating affirmative action in higher education will elminate the "academic mismatch" problem, and increase minority students' GPAs and graduation rates.
Read my article in "affirmative action grading" in the Detroit Free Press from last summer.
Homer's Quotes Now Appear in Oxford Dictionary
 "Kids are the best, Apu. You can teach them to hate the things you hate. And they practically raise themselves, what with the Internet and all."
 "Kids, you tried your best and you failed miserably. The lesson is never try."
London, Aug 22: The famous Homer Simpson will now be giving words of wisdom in the Oxford Dictionary of Modern Quotations. So far, Homer is probably been best-known for one remarkably straight-to-the-point quote - "D'oh!,” but now, Matt Groening, the man behind world's favourite cartoon series has 3 new entries in the latest volume of quotations from the experts at Oxford University (see 2 of the quotes above).
The yellow-headed hero has secured the honour of appearing alongside literary luminaries like Winston Churchill and Oscar Wilde.
(HT: Sanil Kori)
Throw Paper Game
Thursday, August 23, 2007
US (UK) Cancer Survival Highest (Lowest) in World
 Despite Michael Moore's glorification of British health care and the NHS in the movie "Sicko," recent research shows that the cancer survival rates for men and women in the U.K. are the lowest in Europe, and significantly below the rates in the U.S. (see chart above, click to enlarge), which are the highest in the world.
From Britian's Telegraph: "Cancer survival rates in Britain are among the lowest in Europe, according to the most comprehensive analysis of the issue yet produced.
England is on a par with Poland despite the NHS spending three times more on health care.
Survival rates are based on the number of patients who are alive five years after diagnosis and researchers found that, for women, England was the fifth worst in a league of 22 countries. Scotland came bottom. Cancer experts blamed late diagnosis and long waiting lines."
Health Care: From Canada's #3 City to US's #356

Chances of having identical quadruplets: 1 in 13 million.
Chances of having 4 neonatal intensive-care beds available in Canada's 3rd largest city: Not very good.
Chances of having 4 neonatal intensive-care beds available in America's 356th largest city: Excellent.
On Aug. 12, Karen Jepp gave birth to identical quadruplets in Great Falls, Mont. The mother of this one-in-13 million event isn't a Montana resident, however. She's a Canadian. She and her husband were sent from Calgary, Alberta (population 1 million-plus), to Great Falls (pop. 57,000) to deliver the children because, the Calgary Herald reports, "no Canadian hospital had enough neonatal intensive-care beds for all four babies."
From the third-largest city in Canada to a smallish American city (ranked #356 in the U.S., in a state with fewer people than Calgary). This speaks well of Canadian health care? Jepp is the fifth Alberta mother who had to travel to the U.S. this year to give birth because of the neonatal shortages in Calgary.
Incidentally, all four daughters are alive and healthy — uncommon in multiple births. We shudder to think how they'd have fared in Canada or Great Britain, let alone Cuba.
China's Bull Market
 SHANGHAI (Reuters) - China's main stock index climbed for the first time above the 5,000-point level on Thursday, passing another milestone in a spectacular bull run that has more than quadrupled the index since the start of last year, and doubled this year (see chart above, click to enlarge).
The rise was greeted with euphoria by Chinese investors, millions of whom have flooded into the stock market for the first time this year in one of history's fastest shifts of money into equities.
From the Wall Street Journal's report:
China's benchmark Shanghai Composite Index topped 5000 points for the first time Thursday, the latest sign of unwavering confidence in stocks by the investing public of the world's most populous nation.
Within minutes of the start of trading in China, the Shanghai Composite Index was quoted at 5025, up 0.9%. The 5000 level marks a nearly quadrupling since the index bottomed at an eight-year low of 1011.50 in July 2005.
Only last November, the Shanghai index pulled above 2000 for the first time, followed by 3000 in March and 4000 in May.
Wednesday, August 22, 2007
Immigrant Entrepreneurs and Foreign-Born CEOs
Russian immigrant Sergey Brin, co-founder of Google:
 From a recent Forbes article:
According to the National Venture Capital Association, immigrants make up only 11.7% of the U.S. population, but have started one in four of all U.S. public companies that have been venture-backed over the past 15 years, including Intel, Google, Yahoo!, Sun and eBay.
A similar study from Duke University showed immigrants were responsible for starting 25.3% of all new, high-technology businesses in the U.S. during the past 10 years. The greatest percentage of these entrepreneurs hailed from India (26%), followed by immigrants from the U.K., China and Taiwan.
Watch a slide show of Famous Immigrant Entrepreneurs from Forbes.
Daniel Gross at Slate.com has two recent columns on immigrant CEOs of U.S. companies, like Alcoa, Pepsi, Coke, Dow Chemical, Intel, McDonald's, Kellog, Eli Lily, and AIG.
From "Send Us Your Tired, Your Poor, Your Business Executives: Why are big American companies hiring foreign-born CEOs?":
In many ways, this trend makes complete sense. Big American businesses—like Alcoa, Pepsi, Coke, and AIG—are already global businesses. Based on data from 238 members of the Standard & Poor's 500 Index, S&P analyst Howard Silverblatt found that the typical member of the index generated 44.2% of its sales outside the United States in 2006. And the bigger the company—and the more it has saturated the U.S. market—the more important it is to have a CEO who is comfortable operating around the world.
From Senor CEO:
The trend also shows that the benefits of immigration to the U.S. economy derive not just from the way newcomers flood the low end of the workforce, but also from the way newcomers transition easily into, or work their way up to, the high end. American corporations—like American society at large—have demonstrated a far greater ability to assimilate newcomers than many other developed economies. (It would be difficult to find many non-native CEOs at blue-chip companies in France, Germany, or Japan.)
Low-Income Homeownership Boom Goes Bust
Question: Is homeownership a social blessing that should be encouraged with subsidies and public policy?
Answer: According to politicians and the voters who elect them, the answer has been "Yes."
For example, we've had tax subsidies, lending subsidies and a concerted set of government policies to move low-income people out of rental units and into homeownership. The government's goal was to lift the homeownership rate from 64.2% to 67.5% of households, and that goal was achieved. It all sounds good to help low-income groups achieve the "American dream of homeownerhsip," but we are now in a "payback" period for misguided policies that encouraged low-income renters with low-quality credit to buy homes with low down payments and sub-prime loans, often with adjustable rates.
And have higher rates of homeownership actually benefited low-income groups? Apparently not as much as we once thought. From today's Wall Street Journal article "Payback":
Of low-income households from a nationally representative sample who became homeowners between 1977 and 1993, fully 36% returned to renting in two years, and 53% in five years. Suggesting their sojourn among the homeowning was not a happy one, few returned to homeownership in later years.
Even among those who held on to their homes for 10 years, the average price-appreciation gain was 30% -- less than if their money had been invested in Treasury bills. This meager capital gain was about half that enjoyed by middle-income homeowners.
A typical low-income household might spend half the family income on mortgage costs, leaving less money for a rainy day or investing in education. Their less-marketable homes apparently also tended to tie them down, making them less likely to relocate for a job.
And the mortgage-interest deduction, won't turn a house into a paying proposition for those with little income to shelter.
Bottom line: Homeownership likely has had an exceedingly poor payoff for millions of low-income purchasers, perhaps even blighting the prospects of what might otherwise be upwardly mobile families.
Markets in Everything: Car Rental By the Hour
 From today's Wall Street Journal, "Zipcar Goes to College":
Companies such as Zipcar Inc. and Revolution LLC's Flexcar -- which allow customers to rent cars for hours or days -- see a lucrative new market in students, a population that has been largely ignored by traditional rental-car companies.
The car-sharing companies are cutting partnerships with schools nationwide: Flexcar is set to announce deals with Arizona State University and the University of Wisconsin-Milwaukee, and this month it added Ohio State University, the nation's largest school by enrollment last year. Zipcar, the world's largest car-sharing company, says it is launching at between 10 and 15 new schools this fall, including Yale University and Carnegie Mellon University, bringing its total to more than 40.
The cost to the customer includes an hourly usage rate, which is typically around $5 to $10, and an annual membership fee, which usually ranges from $25 to $35. Gas, insurance and an allotment of free miles per day -- 180 at Zipcar, 150 at Flexcar plus 20 with each additional paid hour -- are included. Cars belonging to the programs are typically situated in university-provided parking spaces on campus.
Tuesday, August 21, 2007
Time Cost of Goods: Yesterday vs. Today
 Data in the chart above (click to enlarge) are from the Dallas Federal Reserve Bank, 1997 Annual Report, and show the significant improvements in living standards and purchasing power over time. Prices of various food and household items are stated in "time cost," i.e. the number of minutes or hours that the average person, working at the average wage, would have to work to earn enough income to purchase various items in different years.
 It should be emphasized that this analysis is for the average person, earning the average wage, i.e. the middle class (not the upper class), and the increasing affordability of commonly purchased items means that the average, middle class household is living at a much higher standard of living now compared to previous generations.
The good old days are now. And things keep getting better all the time.
New Houses: 1956 vs. 1996
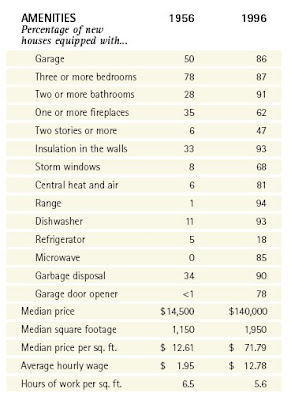 Chart above is from the Dallas Federal Reserve.
 I don't think most people today would be willing to trade their current home for their grandparents' homes. The good old days are now, and they keep getting better.
Computer Prices and Speed: 1970 to 2007


Consider that a Dell computer today costs $550 (pictured above) and runs at a speed of 1.6 GHz (1600 million instructions per second), which is a cost of only 34 cents per MHz.
Bottom Line: Compared to today's desktops, mainframe computers were 128 times slower, more than 8,000 as expensive, and were more than 1 million times as expensive in terms of cost per MHz.
(Data are from the Dallas Federal Reserve and Dell.com.)
More on Indian Higher Education:40 New Colleges
From today's Chronicle for Higher Education (subscription required):
India's university system, which the government has largely neglected in recent years, is now the focus of a reform and development agenda, the country's prime minister, Manmohan Singh, said as he announced plans for several new higher-education institutions.
To ensure that at least a fifth of Indians age 18 to 24 go to college, up from around a tenth, Mr. Singh announced that the government would set up five new Indian Institutes of Science Education and Research, eight new Indian Institutes of Technology, seven new Indian Institutes of Management, and 20 new Indian Institutes of Information Technology.
Only 7% of India's 18-to-24-year-olds are enrolled in higher-education institutions, a proportion that is just half the average for Asian countries. In January a government report recommended that India increase its number of universities to 1,500 by 2015, from only 350 now, to raise the proportion of 18-to-24-year-olds entering higher education to at least 15%. (MP: In contrast, the U.S. has more than 4,000 colleges and universities.)
Mr. Singh lamented that almost two-thirds of the nation's universities and 90% of its degree-granting colleges were rated as below average in quality and that university curricula were typically not synchronized with the needs of employers or job seekers.
Indian Reservations: Entitlement Economy?
No, not Indian reservations in the United States, I'm talking about reservations in India, a government-enforced system of quotas for higher education and government jobs based on caste, religion and language. Like affirmative action in the U.S., reservations in India are highly controversial, because college admissions and job promotions are often not based on merit. In 2006, there were massive anti-reservation rallies and protests in India. India's prime minister (Dr. Manmohan Singh) has apparently suggested extending reservations/quotas to the private sector, which adds to the controversy.
The India Economy blog clarifies the controversy about Indian reservations with this question, and commentary:
Why strive for excellence when mediocrity will suffice?
Singh's government has done nothing to improve the incentives for excellence. Why would a marginal student aspire to be in the top 5% of the class if reservations guaranteed that person a place in an engineering college as long as he made the ‘cut-off’ for his caste or group? And why would the marginal student in the engineering college attempt to score top grades, when quotas guarantee a government job? And why would the marginal government employee strive for excellence if promotions can be had with far less effort, as long as there is a quota?
Mercifully, there is no ‘chalta hai’ (Definition: anything will do; the typical Indian careless attitude, read a story about it here) attitude in the private sector, especially in those segments that have been opened to global competition. That’s one part of India that is indeed striving for global excellence. But why would a marginal employee in a private sector factory strive for excellence when he knows that it’s virtually impossible to sack him for underperformance. Far from easing labour laws that not only stifle excellence but also prevent millions of people from securing employment, Dr. Manmohan Singh’s government wants to introduce job quotas in the private sector.
Far from creating incentives for excellence, the government is determined to create an entitlement economy. If excellence is what we seek, we must organise our society around merit.
Monday, August 20, 2007
Overwhelming Evidence II: Good Old Days Are Now
 On a previous post, I presented historical data to show that we live longer, start to work later in life and work much less annually, spend 30% less time working around the home vs. 100 years ago, retire earlier, have an increasing number of years in retirement, experience 3X as much waking leisure now compared to our ancestors in the 1800s, etc.
In this post, I present more data from economist W. Michael Cox (Federal Reserve Bank of Dallas), showing the significant improvements in living standards that took place during a single 20-year period, from 1970 to 1990 (see chart above, click to enlarge). Certainly, many improvements have taken place since 1990, and a comparison of 2000 to 1970 would be even more remarkable (see post below on microprocessor speed). But I think the evidence is clear and overwhelming: Americans today are better off than at any other time in history, and living standards for the average person just keep getting better, and better and better.
Mad Money=Bad Advice; BOO, NOT BOOYAH!!

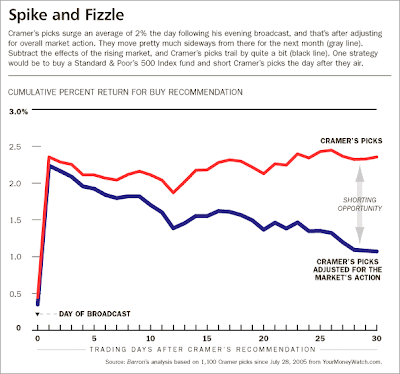 From Baron's cover story "The Cramer Effect, and Defect: Shorting Cramer":
Jim Cramer is held out by CNBC as the guy who can help viewers make big money. But a comprehensive and careful review of his stock picks by Barron's finds that his picks haven't beaten the market. Over the past two years, viewers holding Cramer's stocks would be up 12% while the Dow rose 22% and the S&P 500 16%, according to a record of 1,300 of the CNBC star's Buy recommendations compiled by YourMoneyWatch.com, a Website run by a retired stock analyst and loyal Cramer-watcher (see top chart above).
We also looked at a database of Cramer's Mad Money picks maintained by his Website, TheStreet.com. It covers only the past six months, but includes an astounding 3,458 stocks -- Buys mainly, punctuated by some Sells. These picks were flat to down in relation to the market. Count commissions and you would have been much better off in an index fund that simply tracks the market.
The bottom chart above shows how Cramer's stock picks surge an average of +2% following his recommendations, then remain flat for the next month. Subtracting the effects of a rising stock market, and Cramer's picks trail the overall market by quite a bit.
Read a previous post about Cramer here, with links to other posts about Cramer.
Recommendation: For investment purposes, buy and hold a stock index fund from Vanguard or Fidelity. Watch Cramer for entertainment purposes only.


