Wednesday, March 31, 2010

Global Shipping Rebound Gains Steam, Leading to Shipping Delays, Some Shortages of Container Ships

I've had a couple of persistent requests for updates on global shipping trends, so here is a summary of recent news:

1.
Packed Containers Piling Up At Asian Ports Because There's Too Much Demand From West - "Packed containers are piling up at Asian ports as strong demand from the U.S. and Europe causes a lack of supply of ships. Shipping companies had purposefully idled capacity during the economic downturn, then started to bring it back recently. Yet they didn't do it fast enough to keep up with the robust pick-up in demand from the West."

2.
Shippers Rattled By Shortage Of Ships Due To Trade Surge - "Here's a breath of fresh air for struggling container ship owners -- U.S. shippers are starting to worry about a shortage of container ships, due to the recent trade rebound on Transpacific routes.

A lot of ships were idled during the economic downturn and this dormant capacity is unlikely to come back online fast enough alongside a surge in shipping activity. It's a tangible sign that the global trade rebound is both real and gaining steam."

3.
Rumor: Flood Of Idle Ships Coming Out Of Lay-Up Because They See A Sustained Global Rebound - "Ship owners and managers with a ground-level view of global trade, plus massive skin in the the game of physically shipping goods (bringing a ship out of lay-up is a risky proposition), are starting to regain confidence in the current global rebound. That says a lot more than any pundit or analyst could since when ship owners get it wrong they get murdered (figuratively, usually)."

4.
U.S.-Bound Boxes Pile Up in Asia as Lines Avoid Adding Ships - "South Korea’s biggest port, overwhelmed with empty containers a year ago, is now dealing with shipping lines that have more cargo than they can carry. Surging shipments of furniture, electronics and clothes to the U.S. and Europe, coupled with capacity cuts by shipping lines, has caused as much as 15 percent of containers to be delayed in Busan this year, often by more than a week, according to Park Jong Ho, assistant general manager at Busan International Container Terminal Co.

“With the economy recovering, we have been seeing a lot of containers that didn’t make it out on time because there wasn’t enough space on ships,” he said.

Int'l Air Traffic: Passenger +7.5%, Cargo +26.5%

Geneva - "The International Air Transport Association (IATA) announced that February 2010 international scheduled air traffic showed continued strengthening of demand. Compared to February 2009, passenger demand was up 9.5%, while cargo demand grew 26.5% (see chart above).

These are strong gains, but it must be noted that February 2009 marked the bottom of the cycle for passenger traffic during the global economic recession. Passenger demand must recover by a further 1.4% to return to pre-crisis levels. Cargo hit bottom in December 2008, with little improvement realized by February 2009. Cargo traffic, which plunged much further than passenger demand, has a further 3% to recover in order to return to pre-crisis levels.

“We are moving in the right direction. In two to three months, the industry should be back to pre-recession traffic levels. This is still not a full recovery. The task ahead is to adjust to two years of lost growth,” said Giovanni Bisignani, IATA’s Director General and CEO.

The highlight for February was improved load factors which stood at 75.5%. Considering that February is traditionally the weakest month for travel, and if seasonally adjusted, this translates to an all-time record February load factor of 79.3%."

Canada's Turnaround from a High-Debt, High-Tax, High-Deficit Country to Lowest Tax Rates in G7


TORONTO GLOBE AND MAIL -- "Canada's relatively low corporate taxes have helped to make this country one of the best places in the world for companies to set up shop. Canada ranks second among 10 key countries as a cost-effective place to do business, and relatively low taxes are one of the main factors, consultants KPMG said in a report released yesterday.

KPMG said one key reason for Canada's high standing is that federal and provincial governments have been cutting taxes and reforming tax laws in recent years. Indeed, Canada now has lower business taxes than any other G7 country.

"It's really over the last 10 years Canada's tax position has changed quite significantly from being a high-tax jurisdiction to now actually leading the G7," said Glenn Mair, director of MMK Consulting, which assisted in preparing the KPMG study.

Since 2000, the overall corporate income tax rate in Canada has fallen to about 31 percent from about 43 percent, said Jack Mintz, chair of the University of Calgary's School of Public Policy. It will fall further, to about 26 percent, over the next few years.

When it comes to attracting business, "there is no question that the tax system helps a lot," Mr. Mintz said. Fifteen years ago, "we were viewed as a high-debt, high-tax, high-deficit country," he said. "Today we look like a much better country, and certainly we had a much better balance sheet going into the recession.""


MP: The Heritage Foundation chart above shows that Canada's corporate tax decrease to 26% over the next few years, will put it 12.7% below the U.S. rate of 39.3%, and bring it below the 26.6% average corporate tax rate in 2008 for non-U.S. OECD countries. In quite a turnaround, it looks like Canada and the U.S. have traded places - the U.S. is now the high-debt, high-tax, high deficit country, and Canada has become the low-debt, low-tax, and low-deficit country.

Canada Leads USA in Real Estate Recovery


Canadian home prices in January were up 7.5% from a year earlier, according to the Teranet-National Bank National Composite House Price Index (see top chart above), which was released today. January was the fourth consecutive month in which prices increased from a year earlier, after 10 consecutive months of 12-month deflation. The turnaround is due to nine straight monthly increases in the countrywide index (see bottom chart above) that followed eight straight monthly decreases. Compared to the previous peak in August 2008, home prices in Canada have increased by 1.6%, to set a new record high level in January.

To get an idea how home prices in Canada compare to the U.S. since 2001, the chart below tells the story. Home prices in both countries increased by about 80% since 2001, but peaked much earlier in the U.S. (early 2006) than in Canada (mid-2008), and U.S. home prices fell by much more from the peak (-30%) compared to the drop in Canada (-9%). Home prices have now completely recovered in Canada, whereas it might be many years before home prices in the U.S. return to the 2006 level.


Flat Tax: How it Works and Why It's Good for U.S.


This Center for Freedom and Prosperity Foundation video featuring Dan Mitchell of the Cato Institute shows how the flat tax would benefit families and businesses, and also explains how this simple and fair system would boost economic growth and eliminate the special-interest corruption of the internal revenue code.

If you're getting frustrated completing your tax returns for 2009, note the easy-to-fill-out postcard-size tax forms that would be a key feature of a flat tax. It reminds me of the very first IRS Form 1040, which was a one-page tax form with two pages of simple worksheets, and one page instructions for a grand total of only four pages, view it here.


Haiti's Tent Cities: Incubators for Entrepreneurs

After the devastating earthquake -- tent cities in Haiti have become something of an incubator for entrepreneurs. Watch a Reuters video here.

HT: Colin

Computers Just Keep Getting Cheaper and Better and We Should Eagerly Await the Days Ahead


Craig Newmark points to a great website "Classic PCs vs. New PCs: Their True Cost: Doing the math makes technology's relentless progress even more amazing," where they compare the costs and specifications of various computers from the 1970s and early 1980s to today's computers.

One example is illustrated above: a 1984 Apple Macintosh vs. a 2009 Apple iMac. Adjusted for inflation, today's Apple iMac is 26% cheaper ($3,849) than the 1984 Macintosh ($5,186). Measured in the number of hours of work at the
average hourly wage ($8.48 in 1984 and $18.57 in 2009) to purchase a computer at the retail price in current dollars, the price of an Apple computer has fallen by almost 30% (294 hours in 1984 vs. 207 hours in 2009). But what's maybe even more interesting is to adjust for the phenomenal increase in computer power, and compare the real dollar cost per CPU (MHz) and RAM (KB) in 1984 versus today. Here's that comparison:

Real Dollar Cost per CPU (MHz)
1984 Apple Macintosh: $662.35
2009 Apple iMac: $0.34

Real Dollar Cost per RAM (KB)
1984 Apple Macintosh: $40.52
2009 Apple iMac: $0.00025

In terms of the cost of processing speed (real dollars per MHz), the 2009 Apple iMac is 1,947 times cheaper, and in terms of memory cost (real dollars per KB), the 2009 Apple iMac is 162,000 times cheaper. And keep in mind that the 1984 Macintosh didn't even have a hard drive - you had to store all of your files on a floppy disk!

From the website:

"Computers today are mind-blowingly more powerful than they used to be. More importantly, consumers get vastly more computing power and capacity for their dollar today than they ever have before. The low end of the market gets lower, and the high end…also gets lower. It’s very difficult to buy a non-diamond encrusted $10,000 PC, much less a $20,000 one, which you could do back in 1980s without breaking a sweat. But it’s easy to buy a steel-encrusted $350 bargain PC that’s just as powerful as a top of the line model a few years ago.

From this simple analysis of computer cost, I suspect that baseline desktop PC prices will continue to decrease over time. To what end and how much, I’ll leave to professional market analysts. But I do know that, in the computer industry at least, the past is often a good indicator of broad trends that will continue to unfold for years to come. I eagerly await the days ahead."

MP: If the dramatic price reductions and quality/speed improvements of computers and other electronic products happened suddenly all at once, it would probably be declared to be a miracle. If nothing else, it would certainly catch our attention. But when the price reductions and quality improvements happen continually and relentlessly all the time, we become immune and either don't even pay attention, or tend to take the improvements for granted.

Thankfully, the comparison of today's economy to the Great Depression have started to fade, because it was easy for many to think our standard of living would somehow return to the level of the 1930s. This comparison of computer prices helps us appreciate how technological improvements elevate the standard of living of the average American to levels that previous generations couldn't have even imagined. Another lesson here might be that even a Great Recession can't stop the progress of human ingenuity, technological improvements, and the entrepreneurial spirit that will continue the relentless trend towards better and cheaper products, and a continually rising standard of living.

Tuesday, March 30, 2010

4th Straight Week of Gains for Rail Freight Traffic; 16 of 19 Commodity Groups Increased vs. Year Ago

The Association of American Railroads reported that for the fourth consecutive week, freight traffic on U.S. railroads increased compared with the same period a year ago during the week ended March 20. Highlights include:

1. U.S. railroads originated 287,639 carloads during the week, up 4.3 percent from the comparable week in 2009.

2. Intermodal traffic totaled 201,300 trailers and containers, up 9.5 percent from last year.

3. Sixteen of 19 carload commodity groups showed gains from a year ago, with 13 of them showing double digit percentage gains, led by a 69.2 percent increase in loadings of metals and products. Other commodities showing significant increases included grain, up 24 percent; motor vehicles, up 20.8 percent; waste and scrap, up 33.1 percent; lumber and wood products, up 21.8 percent, and chemicals, up 14.4 percent.

4. Combined North American rail volume for the first 11 weeks of 2010 on 13 reporting U.S., Canadian and Mexican railroads totaled 3,941,811 carloads, up 3.6 percent from last year, and 2,772,992 trailers and containers, up 8.7 percent from last year.

The Rich Are Not Docile Sheep Waiting to Be Shorn

"President Barack Obama's new health-care legislation aims to raise $210 billion over 10 years to pay for the extensive new entitlements. How? By slapping a 3.8% "Medicare tax" on interest and rental income, dividends and capital gains of couples earning more than $250,000, or singles with more than $200,000.

The president also hopes to raise $364 billion over 10 years from the same taxpayers by raising the top two tax rates to 36%-39.6% from 33%-35%, plus another $105 billion by raising the tax on dividends and capital gains to 20% from 15%, and another $500 billion by capping and phasing out exemptions and deductions.

Add it up and the government is counting on squeezing an extra $1.2 trillion over 10 years from a tiny sliver of taxpayers who already pay more than half of all individual taxes.

It won't work. It never works. Punitive tax rates on high-income individuals do not increase revenue. Successful people are not docile sheep just waiting to be shorn."

~Cato's
Alan Reynolds in today's WSJ

Here are some reports on how tax increases on millionaires worked out in Maryland:

1.
Wall Street Journal -- "Maryland's Mobile Millionaires: Income tax rates go up, rich taxpayers vanish."

2.
Washingont Post -- "The number of self-reported million-dollar earners in Maryland has dropped by roughly a third compared with this time last year, renewing debate yesterday about whether the state's year-old "millionaires' tax" is driving rich people beyond its borders."

3.
Baltimore Sun -- Top Payers Fade Away; Maryland Was Depending On Taxing Millionaires, But They're Disappearing.

4.
Wall Street Journal -- Millionaires Go Missing; Maryland's fleeced taxpayers fight back.

Case-Shiller Home Price Indexes Rise for 8th Month


The S&P/Case-Shiller Home Price Indices for January 2010 were released today. Highlights include:

1. Both the 10-City Composite and the 20-City Composite Home Price Indexes have increased for eight consecutive months for the first time since the spring of 2006, almost four years ago, and both indexes in January reached their highest levels in 12 months, since January 2009 (see top chart above).

2. Based on the percentage increase from the same month in the previous year, the annual rates of returns for both home price indexes improved in January for the 12th consecutive month, and while still slightly negative (-0.04% for the 10-City Index and -0.69% for the 20-City Index) the annual returns are close to be being in positive territory for the first time in three years (February 2007).

3. In three of the cities with the biggest annual January-to-January price declines in the Case-Shiller index like Las Vegas (-17.4%), Miami (-6.77%) and Phoenix (-4.5%), I have reported recently (
here, here (for all of Florida) and here) that the home sales in those markets have been strong, and consistently above sales levels from the same month in the previous year in each month for the last year or longer.

For example, both Florida and Las Vegas home sales increased in February for the 18th month in a row, and Phoenix home sales in February were the highest for that month since 2006.

Bottom Line: Nationally, home sales bottomed in January 2009, and have been on an upward trend for the last 12 months. The Case-Shiller Composite Home Price Indexes both reached a bottom in May 2009, and have now increased for eight straight months. Now that there's a gradual upward trend in both home sales and home prices, it's a positive sign that we've moved past the bottom of the real estate market, and are now moving slowly towards a full recovery. The falling prices through the middle of 2009 helped to bring buyers back into the market and bring about a better balance in the market, as excess inventories have gradually been cleared. As Larry Kudlow reminds us, "Market forces work."

Univ. of Florida Fall 2010:150 Women Per 100 Men

According to University of Florida spokesman Steve Orlando, six out of 10 new UF students will be women in fall 2010, which is the largest gender gap favoring female students that UF has ever had. UF’s fall 2009 enrollment was 54% female and 46% male, according to the UF Office of Institutional Planning and Research.

UF is aware of the gap but not doing anything to balance the numbers, Orlando said. But he said the school isn’t discriminating against male applicants. “Boys wouldn’t be admitted because they’re boys,” he said. “Girls are being admitted because they are doing the things to be admitted and boys aren’t.”


MP: Can they really still call it the "freshman" class?

The Power of the Market: Haitian Entrepreneurs Are Kick-Starting the Local Economy in Tent Cities

Nearly three months after the devastating earthquake in Haiti, small businesses are springing up within the tent communities housing displaced people. Adam Davidson of NPR'S "Planet Money" reports on the entrepreneurs who are kick-starting the local economy. Click here to watch video.

"There's more competition now than before the earthquake."

Update on the NYC "Taxi Cartel"; Medallion Prices Reach Record Highs in 2010 of $588k and $779k

The "priciest piece of aluminum in NYC" - a taxi medallion to operate a single cab in NYC - reached a new record-high of $588,000 in February for an individual medallion (see chart above, data here), more than double the average prices in 2004. The average price for a corporate-owned taxi medallion reached a new record high in January at $779,000, and fell slightly in February to $775,000.

Membership in the "taxi cartel" certainly has its privileges: above-market returns of 20.75% per year for corporate medallions and 15.32% for individual medallions in a permanent bull market. See previous CD posts here,
here and here.

Monday, March 29, 2010

Florida Home Sales Increase in February for the 18th Month As Falling Prices Stimulate Sales

"Florida’s existing home sales rose in February, which means that sales activity has increased in the year-to-year comparison for the past 18 months, according to the latest housing data released by Florida Realtors.

Existing home sales increased 21 percent last month with a total of 11,890 homes sold statewide compared to 9,867 homes sold in February 2009. Statewide existing home sales last month increased 13.6 percent over statewide sales activity in January. Florida’s median sales price for existing homes last month was $131,300; a year ago, it was $141,800 for a 7 percent decrease."

From Larry Kudlow's article "
Foreclosures, Lower Prices Will Do Trick":

"And take a look at places like California, Florida and Las Vegas, where foreclosure activity has been high and prices have fallen the most. What you see is a sharp pickup in home sales, which is steadily clearing away the price-depressing inventory overhang of unsold homes. In other words, market forces work."

From
Barry Ritholz's blog:

"It may sound counter-intuitive, but the best thing for the nation (but not necessarily the banks) is to allow the foreclosure process to proceed unimpeded. We need more, not fewer foreclosures."

STEM Research Careers: Not Very Family Friendly

"In an era when women are increasingly prominent in medicine, law and business, why are there so few women scientists and engineers? A new research report by AAUW presents compelling evidence that can help to explain this puzzle. Why So Few? Women in Science, Technology, Engineering, and Mathematics presents in-depth yet accessible profiles of eight key research findings that point to environmental and social barriers – including stereotypes, gender bias and the climate of science and engineering departments in colleges and universities – that continue to block women’s participation and progress in science, technology, engineering, and math."

Diane Auer Jones responds in today's
Chronicle of Higher Education:

"What are the reasons for this persistent gap? According to the report, social and environmental factors are to blame. Shocking. Sadly, this report serves only to regurgitate age-old accusations and assumptions, and to make worn-out recommendations that we've heard so many times before—none of which have proven terribly effective in closing the gap in certain fields.

Research careers are highly competitive. No matter how long you've been at it, to be a successful researcher means competing against a growing group of applicants for a shrinking supply of grant and contract resources. As federal spending on interest and entitlement programs grow, the competition is only going to increase. Peer reviewers and contracting officials are compelled to give priority to those with the strongest track record and the highest likelihood of success, which generally means that the rewards are greatest for those who devote the most time and energy to their work.

This isn't gender bias. It is reality. There are rare exceptions among a few scientists who can focus intensely—or farm the work out to enough graduate students—that they get the job done with breathtaking efficiency. But for the most part, no dean or tenure policy in the world can change the fact that research careers are demanding and not very family friendly, because in general, being smart isn't nearly as important as being persistent, and persistence requires time. Designing better experiments is good, but being there to repeat them over and over again, in every possible iteration, is even better."

The $64 Billion Physician Cartel Got a Free Ride

1. According to a 2007 study by McKinsey Global Institute: "U.S. physicians are more highly paid than their counterparts in other developed countries. U.S. generalists make 4.1 times per capita GDP, compared with 2.8 times per capita GDP in other OECD countries. Across all U.S. physicians, higher earnings add $64 billion in costs to the U.S. system."

2. "How has the American Medical Association managed to get away with such princely remuneration that ordinary mortals in other professions—even ones such as law and engineering that also require arduous training—can only dream of? After all, in a functioning market, a profession offering such handsome returns would become a magnet for more people who, over time, would bid down "excess" wages.

But that's not how it has worked in medicine since 1910 when the Flexner report, commissioned by the AMA, declared that a surplus of substandard medical schools in the country were producing a surplus of substandard doctors. The AMA convinced lawmakers to shut down "deficient" medical schools, drastically paring back the supply of doctors almost 30 percent over 30 years. Few new medical schools have been allowed to open since the 1980s.

~
Shikha Dalmia

3. There are 131 medical schools in the U.S. (
data here), which is 21% fewer than the number of medical schools 100 years ago (166 medical schools, source), even though the U.S. population has increased by 300%.

By restricting the supply of medical schools and physicians, the AMA has "
enforced cartel-like restrictions on entry that benefit physicians at the expense of consumers, and which have created significant barriers to effective, cost efficient health care."

4. Here's one recent example of the "AMA Cartel's" attempt to restrict competition:

NASHVILLE -- St. Jude Children's Research Hospital won unanimous state legislative approval to bring foreign-trained physicians onto its Memphis staff without the one- to three-year U.S. medical residencies required for a Tennessee medical license.

The bill won 97-0 approval in the House Thursday and it passed the Senate 33-0. Although it won unanimous approval, the Board of Medical Examiners voted in January to voice its opposition, out of concern it will open the door for other institutions to seek exemptions.

"While the board acknowledges and fully appreciates the wonderful work done at St. Jude, we are gravely concerned about the precedent-setting nature of the bill and thus unanimously oppose it. It is the board's view that should this well-intentioned legislation become law, it would open the door for any institution whose physicians cannot otherwise qualify for licensure ... (to) seek legislation that would create similar special licensure," the examiners' letter said.

5. And the AMA Cartel doesn't just want to restrict the supply of physicians, it also wants to restrict competition from other health care providers, like retail health clinics. For example:

MedPage Today -- Retail clinics first came on the scene in the middle of the last decade, and there are now some 1,200 of them operating in 32 states, according to the Convenient Care Association, a retail clinic trade association founded in 2006.

Not surprisingly, retail clinics have been targeted nearly from their inception by physician organizations, which charge that the clinics disrupt continuity of care and provide lower-quality care than physicians' offices or hospitals. In a 2006 policy statement, the American Academy of Pediatrics (AAP) said flatly, "The AAP opposes [retail clinics] as an appropriate source of medical care for infants, children, and adolescents and strongly discourages their use, because the AAP is committed to the medical home model."

6.
Another example: "Midwifery, once a robust industry in this country, has been virtually destroyed, thanks to the intense lobbying against it by the medical industry. In 1995, 36 states restricted or outright banned midwifery, even though studies have found that it delivers equally safe care at far lower prices than standard hospital births."

MP: The $64 billion estimate of higher health care costs resulting from excessive physician compensation in the U.S. is just part of the story. The AMA's aggressive turf-protection against competition from retail clinics, midwives, pharmacists, and chiropractors have added additional medical costs that go way beyond just the $64 billion. In all of the discussions about health care costs and health care reform over the last year, the cartel power of physicians and their excessive compensation was barely mentioned.

Markets in Everything: Market-Based Health Care in Canada

"The distinguishing feature of Canadian public healthcare is the nearly universal waitlists for virtually all diagnostic procedures and for surgeries (see chart above). The public health care system in Canada has a waitlist in every province and surgery dates are often cancelled or bumped due to a more urgent case arising or a shortage of beds being available.

Timely Medical Alternatives was founded in 2003 as Canada’s first facilitator of private pay medical services and diagnostic imaging. Since then, we have expedited private medical services for thousands of clients and in the process, have saved the lives of 6 of our fellow Canadians.

We are able to facilitate private medical services and diagnostics within 2 – 3 days and surgeries as quickly as 48 hours, in urgent cases. Many of our referrals are to facilities within Canada, and some are available in the U.S., where we have a network of hospitals and private medical services clinics with which we work."

Sunday, March 28, 2010

Milton Friedman in 1978:Market-Based Health Care


In 1978, at the Mayo Clinic, Milton Friedman discussed the free market solution to America's health care problems, and the more "general problem America faces - whether we are going to continue down the road to a completely collectivist society in every area, as we have been going for the past 40 years, or whether we are going to stake thought and halt that trend."

Nobel Economist Gary Becker in the WSJ: Drafting A Good Health Care Bill Would Have Been Easy

"The health care legislation is a bad bill. Health care in the United States is pretty good, but it does have a number of weaknesses and this bill doesn't address them. It adds taxation and regulation. It's going to increase health costs—not contain them.

Drafting a good health care bill would have been easy. Health savings accounts could have been expanded. Consumers could have been permitted to purchase insurance across state lines, which would have increased competition among insurers. The tax deductibility of health-care spending could have been extended from employers to individuals, giving the same tax treatment to all consumers. And incentives could have been put in place to prompt consumers to pay a larger portion of their health-care costs out of their own pockets.

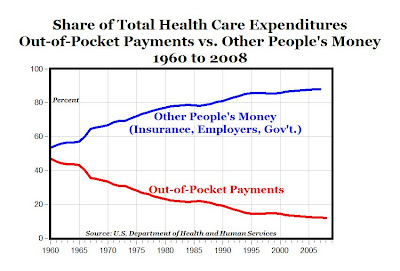
Here in the United States we spend about 17% of our GDP on health care, but out-of-pocket expenses make up only about 12% of total health-care spending (see chart above). In Switzerland, where they spend only 11% of GDP on health care, their out-of-pocket expenses equal about 31% of total spending. The difference between 12% and 31% is huge. Once people begin spending substantial sums from their own pockets, they become willing to shop around. Ordinary market incentives begin to operate. A good bill would have encouraged that."

~Nobel economist
Gary Becker in the WSJ

Las Vegas Feb. Home Sales Highest in Four Years

From DQNews -- Las Vegas region February home sales fell just shy of their 16-year average but were still the highest for that month in four years as investors and first-time buyers continued to dominate the market. Other highlights include:

1. Foreclosure resales – homes that had been foreclosed on in the prior 12 months – fell to 59.6% of all resales in February, down from 62% in January and down from 70.6% a year ago.

2. A total of 3,698 new and resale houses and condos closed escrow in the Las Vegas-Paradise metro area in February, up 9.8% from January and up 10.5% from a year earlier (see chart above). A rise in sales between January and February is normal for the season, with the gain averaging 5.7% since 1994.

3. February’s sales total was the highest for that month since February 2006, when 6,065 homes sold, but it was 2.0% lower than the average February sales tally back to 1994.

4. Last month marked the 18th in a row in which total sales rose on a year-over-year basis.

5. The number of existing houses and condos that resold (excludes new homes) in February rose to 3,311, up 7.1% from January and up 9.5% from a year earlier to the highest point since 3,875 resales in February 2005.

6. Existing-home resales have risen on a year-over-year basis for 22 straight months.

7. The median price paid for all new and resale houses and condos sold in the Las Vegas metro area in February was $126,197, up 0.4% from $125,750 in January but down 17.2% from $152,500 a year earlier (see chart above). The year-over-year decline was the smallest since March 2008, when the median dropped 16.0% from a year earlier, to $247,925.

Currency Manipulation Used to Be Law of the Land; Isn't Hong Kong Also A Currency Manipulator?

"We shouldn’t forget that what they are calling “currency manipulation” today was the law of the land between WWII and the early 1970s. The Bretton Woods system was a system of currency manipulation (i.e. currency fixing or pegging) and movements away from its rules were considered breaking the rules."


MP: The chart above shows that the value of the Hong Kong dollar has been fixed at a fixed exchange rate of 7.8 Hong Kong dollars to the U.S. dollar for the last 25 years, while the Chinese Yuan has fluctuated from between 3 yuan and 9 yuan to the U.S. dollar over the last 25 years. Why are there never any claims that Hong Kong is a "currency manipulator"?

Treasury Spread Model: No Chance of Double-Dip


A few weeks ago, the New York Federal Reserve updated its "Probability of U.S. Recession Predicted by Treasury Spread" with data through February 2010, and the Fed's recession probability forecast through February 2011 (see top chart above). The NY Fed's model uses the spread between 10-year (3.69% in February) and 3-month Treasury rates (0.11% in February) to calculate the probability of a recession in the U.S. twelve months ahead (see details here).

The Fed's model (
data here) shows that the recession probability peaked during the October 2007 to April 2008 period at around 35-40%, and has been declining since then in almost every month. For February 2010, the recession probability is only 0.57% (about 1/2 of 1%) and by a year from now in February 2011 the recession probability is only .054%, the lowest reading since April 1993.

According to the NY Fed Treasury Spread model, the recession ended sometime in middle of 2009, and the chances of a double-dip recession through early 2011 are essentially zero.

Phoenix Housing Markets Shows Signs of Recovery; February Home Sales Highest Level in Four Years

From DQNews -- Phoenix region total home sales (houses and condos) in February rose to the highest point for that month in four years and posted a normal gain over January as already-robust demand from absentee and cash-only buyers grew. The median sale price inched up from the month before and was the same as a year ago, marking the first time since January 2007 that the overall median didn’t drop on a year-over-year basis. Other highlights:

1. The $131,900 median paid for existing, single-family detached houses was 5.5% higher than a year ago – the first time that median increased year-over-year since March 2007.

2. The median price paid per square foot for those resale houses increased 5.8% percent from a year ago, marking the first annual gain since October 2006.

3. A total of 6,824 new and resale houses and condos closed escrow in February, up 9.6% from the month before and up 13.0% from a year earlier (see chart above).

4. February’s total sales were the highest for that month since February 2007, when 8,940 homes sold. Total resales – houses and condos combined – were the highest for a February since 2006.

5. The median price paid in February for all new and resale houses and condos combined was $135,000, up from $131,540 in January and the same as a year earlier (see chart). The median paid last month for resale single-family detached houses was $131,900, up 1.5% from $130,000 in January and up 5.5% from a year ago.

6. Foreclosure activity dipped in February: The 4,635 single-family house and condo units foreclosed on in the Phoenix region represented a 6.2% decline from January and an 18.4% drop from a year earlier.

MP: Phoenix housing sales in February were the highest since 2006, with some upward movement in single-family home prices, and a reduction in foreclosure activity in February - important factors that signal a gradual recovery in one of the hardest-hit real estate markets.

Saturday, March 27, 2010

Paul Ryan on Fixing Entitlements


Rep. Paul Ryan: "We’re really on the cusp of trading our free market democracy, the American idea, for a cradle-to-grave social welfare state that will bankrupt us."

100-Point Increase in SAT = $2,350 for Egg Donors

Top Students Earn Big Money for Egg Donations

"Holding all else equal, such as demand for in vitro fertilization within a state and donor agency variables, Levine found that each increase of 100 SAT points in the average for a university increased the compensation offered to egg donors at that school by $2,350."

Friday, March 26, 2010

There Are No Other Major Retailers Willing to Come to the South Side of Chicago, Except One

CHICAGO — "Wal-Mart Stores Inc. has won the support of dozens of church ministers in its long-running battle to expand in Chicago, a sign of how the recession has softened skepticism of the retailer in a community desperate for jobs. The ministers, most of them African-Americans together representing thousands of congregants, are pressuring the city council to grant approval for a Wal-Mart "supercenter"—a store with a full grocery that also sells general merchandise—on the city's South Side. The ministers who support Wal-Mart say that if the city council doesn't act favorably on an ordinance that would allow the Chatham Wal-Mart, they will campaign against elected officials.

"The reality of the day is that there's no other retailer willing to come to the community," said Alderman Howard Brookins, a Democrat whose ward includes the development. "As the economy has faltered, there has been a renewed appreciation among customers for the Wal-Mart brand," said Julie Murphy, a Wal-Mart regional general manager involved in the company's recent effort to build support in the city."

Thursday, March 25, 2010

Why Inflation Concerns Are Overblown: Annual M2 Growth Falls Below 1%, Lowest Rate Since 1995

Federal Reserve data show that the M2 growth rate on an annual basis fell in the week ending March 15 to 0.85%, the lowest money growth rate since May 1995 (see graph above). Notice also in the graph above that M2 growth in 2001 was actually above 10% for a longer period of time, than the money supply growth in early 2009. Further, there has been a much sharper decline in money growth in the last year than the decline between 2002 and 2005, when the growth rate fell but never went below 2.5%. In each of the last 10 weeks, M2 growth has been below 2.5%. Considering that average annual inflation never got higher than 3.4% in 2005 following the 10% M2 increase in 2001, so it just doesn't seem like there's enough money growth to create inflationary pressure now, at least nothing higher than maybe 3%.

Dallas Fed President Robert McTeer seems to agree in his Forbes article "Why Inflation Worries Are Overblown":

"It will no doubt come as a surprise to many that money growth has been moderate since its initial explosion at the end of 2008 (see chart above). That’s because they hear so much about the expansion of the Fed’s balance sheet, which would normally imply an expansion of bank reserves and money. Fed assets have more than doubled with virtually all the increase taking place in late 2008. The asset expansion has produced a sharp rise in bank reserves, and hence the monetary base, which is composed of bank reserves and currency outside the banking system.

However, banks have not used those reserves to expand loans and investments at a rate large enough to produce rapid money expansion. Instead, banks have accumulated reserves far in excess of the amount required to back their deposit liabilities. This accumulation of “excess reserves” is no doubt the result of banker uncertainty and fear about their viability during the period of crisis. In particular, banks are remaining more liquid than regulations require to protect their remaining capital. Virtually all of the expansion in the Fed’s assets are matched by an expansion of excess reserves—excess from a regulatory standpoint, but obviously not excess to the bankers themselves since they are holding them voluntarily."


Updates: Thanks to Scott Grannis for his most recent M2 post here from earlier today, and for adding one additional week of money supply data that doesn't appear at the St. Louis Fed website, but does appear here at the Fed. The growth rate in M2 in the week ending March 15 was 0.85%, the first time since May 1995 of M2 growth below 1%.

Markets in Everything: Lost iPod Touch Bidding War

Thanks to Mary Ritenour.

3 Reasons Healthcare Reform Won't Cut Deficit


From Reason.tv.

Jobless Claims (4-wk. Avg.) Fall to 18-Month Low

WASHINGTON, March 25 (Reuters) - "The number of U.S. workers filing new applications for unemployment insurance fell sharply last week, while the number of those on continued benefits was the lowest since December 2008, a government report showed on Thursday.

The decline in initial claims last week pushed them into a range that analysts reckon signals labor market stability. The labor market has lagged the economy's recovery from its worst downturn since the 1930s, but payrolls are expected to grow this month as the government steps up hiring for the 2010 census.

The four-week moving average of new claims, which irons out week-to-week volatility, fell 11,000 to 453,750."

MP: Based on the new revised jobless claims data, the four-week moving average fell to its lowest level last week (543,750) since September 13, 2008, and has now fallen by 175,500 from the peak last April of 643,000. Although there are many predictions of continuing weakness in the labor market, the worst is definitely behind us, and the trend in jobless claims over the last year suggests a gradual return to labor market stability, as the Reuters article reports.

Adjusted for the size of the labor market, jobless claims (4-week average) have now fallen to around 0.30% of the labor force. During the last two recessions (1990-1991 and 2001), that level of jobless claims (as a share of the labor force) was reached when the recessions had definitely ended, and in both cases signalled the beginning of the end to the two "jobless recoveries" that followed those two recessions. More analysis to follow on this topic.

Markets in Everything: Market-Based Beer and Food Pricing at NYC Restaurant

NEW YORK (Reuters) - "What's the value of a pint of beer? Let the market decide, says a new restaurant in Manhattan where prices for food and beverages will fluctuate like stock prices in increments according to demand."

"The Exchange Bar & Grill, set amid the bustling shops and pubs of the Grammercy Park neighborhood, is replete with a ticker tape flashing menu prices in red lettering as demand forces them to fluctuate."

Wednesday, March 24, 2010

Durable Goods Orders Increase for Third Month


WASHINGTON (MarketWatch) - "Demand for U.S.-made durable goods rose a seasonally adjusted 0.5% to $178.1 billion in February, the third straight increase in a key forward-looking indicator, according to Commerce Department data released today. New orders for machinery and civilian aircraft were strong in February, while new orders for autos, defense goods and electronics declined. The 0.5% increase in durable goods orders was weaker than the 1.7% gain expected by economists surveyed by MarketWatch. However, January's orders were revised higher, from a 2.6% gain to 3.9%. December's orders were also revised higher."

MP: New orders for durable manufactured goods in February reached the highest level ($178.1 billion) since November 2008 (see top chart above). The 12-month percentage change in February of 10.9% followed an 11.9% increase in January, which was the highest annual increase in new orders for durable goods and equipment from U.S. manufacturers since September 2006, more than three years ago (see bottom chart). The last time there were two consecutive double-digit monthly increases in durable goods orders was four years ago in the spring of 2006.

Add this to the growing list of V-shaped signs of economic recovery, especially in the U.S. manufacturing sector.

Tuesday, March 23, 2010

Job Approval of the 111th Congress: Only 17.4%

Real Clear Politics.

U.S. Financial Markets Return to Pre-Crisis Levels

The CBOE Volatility Index (^VIX) closed at 16.35 today, the lowest closing value since May 15, 2008 and the second lowest closing value since July 2007, more than two-and-a-half years ago (see top chart above). The VIX has closed at or below 17.0 for five consecutive days, for the first time since July 2007.

The Bloomberg U.S. Financial Conditions Index (BFCIUS) has closed above or close to 0.50 for the last nine days, for the first time since June 2007 (see bottom chart above).

Taken together, the return of these two important market indicators of: a) stock market volatility (VIX), and b) the overall conditions in U.S. financial and credit markets (BFCIUS), to their pre-crisis levels of the summer of 2007 provide further evidence that the worst is far behind us, and U.S. financial markets are once again stable and healthy.

Milton Friedman in 1978 Discussing Equal Pay Act


"The free market, by enabling people to compete openly, is the most effective device that has ever been invented for making people pay for their prejudices, and thus for making it costly for them to exercise it. What you do when you impose equal pay for equal work law, is that you make the expression of prejudice costless, and as a result you harm the people you intend to help."

Thanks to Matt Bixler.


Health Care Reform Will Raise, Not Lower, Deficits

"Last Thursday, the Congressional Budget Office reported that health care reform legislation would, over the next 10 years, cost about $950 billion, but because it would raise some revenues and lower some costs, it would also lower federal deficits by $138 billion. In other words, a bill that would set up two new entitlement spending programs — health insurance subsidies and long-term health care benefits — would actually improve the nation’s bottom line.

Could this really be true? How can the budget office give a green light to a bill that commits the federal government to spending nearly $1 trillion more over the next 10 years?

The answer, unfortunately, is that the budget office is required to take written legislation at face value and not second-guess the plausibility of what it is handed. So fantasy in, fantasy out.

In reality, if you strip out all the gimmicks and budgetary games and rework the calculus, a wholly different picture emerges: The health care reform legislation would raise, not lower, federal deficits, by $562 billion."

~Former CBO Director Douglas Holz-Eakins (and currently president of the American Action Forum),
writing in the NY Times

Food, Clothing, Housing Costs at All-Time Lows?

Median priced existing single-family home in the Midwest (January 2010): $127,200

Monthly payment with 20% down payment and 5.1% mortgage: $553

Qualifying annual income required to buy a $127,200 home: $26,544

Median annual family income in Midwest: $59,961

Midwest Housing Affordability Index: 225.9%

MP: I'm not sure if that's a record high for Midwest home affordability (most recent data here), but it seems pretty amazing that: a) the typical Midwest family has more than twice the income necessary to purchase a median priced home, b) the median priced home in the Midwest is so low ($127,200), and c) it's possible to purchase a median-priced Midwest home with less than $27,000 of household income (assuming a 20% down payment of $25,440).

That would mean that a married couple both working at Wal-Mart full-time (34 hours per week), at an average hourly wage of $9.68, would have household income of about $33,000, almost $6,000 more income than the $27,000 required to buy a median-priced house in the Midwest. Of course, the Wal-Mart couple very likely wouldn't have the $25,000 down payment, but they wouldn't necessarily have to buy the median priced home and they wouldn't necessarily have to put 20% down.

With all of the talk about stagnant or declining wages, increasing income inequality, the disappearing middle class, etc. the fact that the typical household in the Midwest has more than twice the income necessary to buy a typical house suggests that it really can't be all that bad. As I reported recently, clothing is cheaper than ever before in history (less than 3% of disposable income in 2009), and food is cheaper than ever before (9.6% of disposable income in 2008). With home prices and mortgage rates so low, it's also likely that housing costs as a share of disposable income are also at historical lows (update to follow).

Monday, March 22, 2010

Children, Our Most Precious Commodity and Unions

"Gallup has been polling public opinion about unions since the 1930's. Last year, for the first time, less than half (48 percent) of those surveyed approved of unions. Fifty one percent said unions "mostly hurt" the U.S. economy and 39 percent said they "mostly help." The percentage of the nation's private sector work force that belongs to a union has dropped precipitously. In the 1950's, over 30 percent belonged to unions. Today it's a little over seven percent.

But in our public schools, the direction is completely opposite. In 1960, about 35 percent of public school teachers belonged to unions and today it's twice that at 70 percent.

Is it not counterintuitive that most Americans feel unions hurt us, that we allow increasingly fewer goods and services produced in our private sector to be controlled by unions, but we turn increasingly more of our most precious commodity -- our children and their education -- over to a union-controlled workforce?"

~Star Parker

Almost All of the Gender Wage Gap Can Be Fully Explained and Yet Legislation is Pending to "Make Real Progress"

In 2007, the ratio of the median earnings of women and the median earnings of men was 79.6 percent, reflecting a raw gender wage gap of 20.4 percent.

From the 2009 study "
An Analysis of the Reasons for the Disparity in Wages Between Men and Women," prepared by the Consad Research Corporation for the Department of Labor:

"In the political domain, the values calculated for the raw gap have been interpreted by many people as a clear indication of overt wage discrimination against women, and have been advanced as a justification for proposed policies mandating equal pay or comparable worth
. In the economic domain, the values calculated for the raw gap have been the stimulus for a substantial amount of scholarly research that has attempted to identify the sources of the observed differences in earnings, and to evaluate their relative importance.

There are observable differences in the attributes of men and women that account for most of the wage gap. Statistical analysis that includes those variables has produced results that collectively account for between 65.1 and 76.4 percent of a raw gender wage gap of 20.4 percent, and thereby leave an adjusted gender wage gap that is between 4.8 and 7.1 percent. These variables include:

1. A greater percentage of women than men tend to work part-time. Part-time work tends to pay less than full-time work.

2. A greater percentage of women than men tend to leave the labor force for child birth, child care and elder care. Some of the wage gap is explained by the percentage of women who were not in the labor force during previous years, the age of women, and the number of children in the home.

3. Women, especially working mothers, tend to value “family friendly” workplace policies more than men. Some of the wage gap is explained by industry and occupation, particularly, the percentage of women who work in the industry and occupation.

4. Research indicates that women may value non-wage benefits more than men do, and as a result prefer to take a greater portion of their compensation in the form of health insurance and other fringe benefits.

5. More of the raw wage gap could be explained by including some additional variables within a single comprehensive analysis that considers all of the factors simultaneously; however, such an analysis is not feasible to conduct with available data bases.

6. This study leads to the unambiguous conclusion that the differences in the compensation of men and women are the result of a multitude of factors and that the raw wage gap should not be used as the basis to justify corrective action. Indeed, there may be nothing to correct. The differences in raw wages may be almost entirely the result of the individual choices being made by both male and female workers."


MP: And yet the House passed the Paycheck Fairness Act in 2009, and the Senate recently held hearings on an identical version of the bill, which is described here by the AAUW:

"A much needed update of the 45-year-old Equal Pay Act, the Paycheck Fairness Act is a comprehensive bill that would create stronger incentives for employers to follow the law, empower women to negotiate for equal pay, and strengthen federal outreach, education and enforcement efforts. Championed by longtime AAUW friend Rep. Rosa DeLauro (D-CT), the bill would also deter wage discrimination by strengthening penalties for equal pay violations and by prohibiting retaliation against workers who ask about employers' wage practices or disclose their own wages. Together with the Ledbetter bill, this critical piece of legislation can help create a climate where pay discrimination is not tolerated, and give the new administration the enforcement tools it needs to make real progress on pay equity."


Real progress on pay equity? According to the Department of Labor study, pay equity is a reality already and there is no wage discrimination once all relevants factors are considered.

Thanks to Christina Sommers.

Sunday, March 21, 2010

Why Obamacare Won't Work: It Will Be Rational for People and Companies to Drop Insurance, Pay Fine

Last November, Martin Feldstein pointed out a fatal flaw of Obamacare in the Washington Post: It will be rational for individuals and companies to drop their current health insurance, pay the penalties, and wait to purchase insurance when they get sick:

A key feature of the House and Senate health bills would prevent insurance companies from denying coverage to anyone with preexisting conditions. The new coverage would start immediately, and the premium could not reflect the individual's health condition.

This well-intentioned feature would provide a strong incentive for someone who is healthy to drop his or her health insurance, saving the substantial premium costs. After all, if serious illness hit this person or a family member, he could immediately obtain coverage. As healthy individuals decline coverage in this way, insurance companies would come to have a sicker population. The higher cost of insuring that group would force insurers to raise their premiums. (Separate accident policies might develop to deal with the risk of high-cost care after accidents when there is insufficient time to buy insurance.)

In an attempt to prevent this, the draft legislation provides penalties for individuals who choose not to buy insurance and for employers that do not offer health insurance. But the levels of these fines are generally too low to cause a rational individual to insure.

Consider: 27 million people are covered by health insurance purchased directly, i.e. outside employer-based plans. The average cost of an insurance policy with family coverage in 2009 is $13,375. A married couple with a median family income of $75,000 who choose not to insure would be subject to a fine of 2.5 percent of that $75,000, or $1,875. So the family would save a net $11,500 by not insuring. If a serious illness occurs--a chronic condition or a condition that requires surgery--they could then buy insurance. Since fewer than one family in four has annual health-care costs that exceed $10,000, the decision to drop coverage looks like a good bet. For a lower-income family, the fine is smaller, and the incentive to be uninsured is even greater.

The story is similar for single people. The average cost of an individual policy is $4,800. An individual with earnings of $50,000 would face a fine of $1,250 and would therefore save $3,550 by not insuring.

In short, for those who are now privately insured through employers or by direct purchase, there would be substantial incentives to become uninsured until they become sick. The resulting rise in the cost to insurance companies as the insured population becomes sicker would raise the average premium, strengthening that incentive.

MP: What would make this choice to drop insurance and pay the penalty even more rational is the convenient, low-cost availability of basic health care from 1,200 retail clinics around the country for basic, routine health care.

America's Weak Dollar Policy Amounts to the Biggest Currency Manipulation in Human History

The US Dollar depreciated by 37% between 2002 and 2008 (data here), see graph above.

Tough talk from abroad, an editorial in the
London Telegraph:

"Obama has called on China to adopt a more "market-oriented exchange rate." The US Treasury Department, meanwhile, has set a mid-April deadline to decide whether China truly is a "currency manipulator," warning that America could impose new levies on Chinese products if that's judged to be the case.

The president is playing with fire. For one thing, his country is being kept afloat by China's willingness to keep buying U.S. government debt. Obama really should tread carefully. At the same time, the US is now at risk of sparking what could be an all-out trade war.

The reality is that America's "weak dollar" policy – its long-standing practice of allowing its currency to depreciate in order to lower the value of its foreign debts – amounts to the biggest currency manipulation in human history. At the same time, the U.S. has, for years, shamefully stalled on various rulings passed by the World Trade Organisation that show America to be breaching global trade rules.

Chinese inflation is now at 2.7% – close to the official 3% target. Beijing will eventually allow the yuan to rise, but in its own time and in order to tackle inflation and not because of US pressure. America needs to act smarter and get its own economic house in order. Obama has decided instead to lash out at China in a desperate attempt to placate a U.S. electorate increasingly mindful of their president's failings."

MP: The U.S. has also stalled the free trade agreements with Panama, Colombia and South Korea, which were passed in 2007 and are now languishing into a fourth year.