CARPE DIEM
Professor Mark J. Perry's Blog for Economics and Finance
Saturday, February 14, 2009
About Me
- Name: Mark J. Perry
- Location: Washington, D.C., United States
Dr. Mark J. Perry is a professor of economics and finance in the School of Management at the Flint campus of the University of Michigan. Perry holds two graduate degrees in economics (M.A. and Ph.D.) from George Mason University near Washington, D.C. In addition, he holds an MBA degree in finance from the Curtis L. Carlson School of Management at the University of Minnesota. In addition to a faculty appointment at the University of Michigan-Flint, Perry is also a visiting scholar at The American Enterprise Institute in Washington, D.C.
Previous Posts
- Cartoon of the Day
- Another Bike-Sharing Program is Failing: Paris
- Obama's Fearmongering: Bad History, Bad Economics;...
- 60 Minutes: CEO Making $2.77 Million Wants Protect...
- China Looks Set to Be the First Major Economy to R...
- First Time in History: 50% of World is Middle-Class
- The Only Real Stimulus: Real Tax Cuts
- Global Economic Activity On the Rebound?
- Will Stimulus Become a $3 Trillion Nightmare?
- Monopoly Unionism = Economic Anti-Stimulant


10 Comments:
http://www.mint.com/blog/finance-core/a-visual-guide-to-the-financial-crisis-unemployment-rates/
Its too bad a few Professors couldn't get a taste of the unemployment line.
The way unemployment is being measured has been changed. If we used the same methods today as were used before the changes were made we would find out that unemployment is almost at the level that was seen in the early 1980s.
For you youngsters, one big difference is that there was not a sublayer of chronic UNDERemployment in the early 1980s, as there is today.
"If the current unemployment rate was calculated as it was 80 years ago..."
Golly gee, jefferson and VangeIV, maybe if auto mileage was calculated the way it was 80 years ago we could measure it in cords of wood run through a Stanley Steamer.
Nice try boneless. The finance people still measure wealth by the Indexes: you know the S&P 500, Russel 200 and the Dow 500, not much has changed for the past hundred years until they are rebalanced its the same with the unemployment rate.
"Its too bad a few Professors couldn't get a taste of the unemployment line"...
Hmmm, and you know that there aren't professors standing line?
"If we used the same methods today as were used before the changes were made..."...
What were those alledged changes?
"one big difference is that there was not a sublayer of chronic UNDERemployment in the early 1980s, as there is today"...
Hmmm, more Henrietta Hughes, eh?... ROFLMAO!
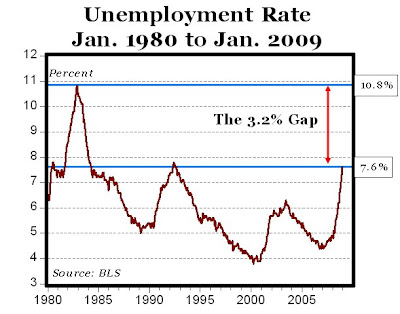
The jobless rate gap is 2.2% for workers aged 25+ (85% of the labor force).
For workers aged 25+ the jobless rate in January 1982 was 6.4% peaking in December at 8.6% (the cycle peak).
For workers aged 25+ the jobless rate in January 2009 is 6.4%. Will this jobless rate cycle peak before 8.6%?
If one is to compare jobless rates over time, one must decompose the labor force. The python swallows the pig.
Now back to your crayons, juandos.
Even disregarding the other observations about underemployment and the way unemployment is calculated...
Looking at that chart, I'd say we have about 9 months before we're caught up.
Eighty years ago? We don't need to go that far back to see the changes to the way that unemployment is counted. Until the Clinton administration changed the methodology discouraged workers who were willing and able to work but had given up looking were counted as unemployed. When the Clinton administration changed the rules workers who have given up because they can't find a job are no longer counted. Add the underemployed who can't find full time jobs, the effects of the birth/death model and other biases and the true unemployment rate in the US is at least 6% higher than what is being reported.
Per his/her/its usual style another link (2.2%) doesn't work...
Good job anon!
"For workers aged 25+ the jobless rate in January 2009 is 6.4%. Will this jobless rate cycle peak before 8.6%?"...
Hmmm, depends on whether these people will have the skills that are wanted in the market place, right?
"If one is to compare jobless rates over time, one must decompose the labor force. The python swallows the pig."...
Again your assesment of the what's posted at your link has nothing to do with what the document is about...
A graduate of the government run madrassas are you?
If you are any indication of the GenX or later crowd, no wonder their unemployment numbers are higher than they need to be...
Thanks for playing...
Post a Comment
<< Home