Saturday, September 30, 2006

Online Retail vs. "Brick-and-Mortar" Retail

Q: Which has a larger market value?

1: The approximately 5,000 retail stores in the U.S. owned by two retail giants: Federated (Macy's, Bloomingdale's, Filenes, Hecht's, etc., about 1,000 stores), and Sears Holdings (Sears and K-Mart, about 4,000 stores).

2: Ebay and Amazon?

A: #2!

Federated and Sears have a combined market value of $47 billion and Ebay and Amazaon have a combined market value of $50 billion.

Friday, September 29, 2006

Significant Income Inequality for the NFL?

1. USA Today has a database of salaries for all professional athletes in the NFL, NBA, NHL and MLB, annually from 1988 to 2006. As one example, the Minnesota Vikings in 2005 had a payroll of $85.4 million for a roster of 61 players, a median salary of $596,100, and an average (mean) salary of $1.4 million. The lowest paid player was T.J. Cottrell ($139,840), and the highest paid player was Fred Smoot ($12.3 million).

2. The IRS keeps a database of income tax returns, and does an analysis of the
share of total income earned by different groups of taxpayers. For example, in 2004 (most recent year) here are the shares of total income earned by differnent groups of taxpayers:

Top 1% earned 19% of all income ($328,000 income or higher)
Top 5% earned 33% of all income ($137,000 income or higher)
Top 10% earned 44% of all income ($99,000 income or higher)
Top 25% earned 66% of all income ($60,000 income or higher)
Top 50% earned 86% of all income ($30,000 income or higher)

3. Many people express concern about the inequality of income across all taxpayers.

How are the above items connected?

Well, even the lowest paid Viking is in the top 5% of all taxpayers, most Vikings are in the top 1%, and many are in the top 1/2 of 1%. So I am sure nobody feels sorry for them. But wait a minute! Couldn't there be significant income inequality among this group of "the rich."

Here is the breakdown for the Minnesota Vikings:

The top 1% of the team earned 14.5% of total income (payroll)
The top 5% of the team earned 31.4% of total income (payroll)
The top 10% of the team earned 48% of total income (payroll)
The top 25% of the team earned 71% of total income (payroll)
The top 50% of the team earned 88% of total income (payroll)

Hmmmmmmmmmmm. If you compare the percentage breakdowns above, it seems like there is about just as much income inequality among the "super-rich" Minnesota Vikings, as among the general population. Maybe such income inequality is natural, and should be expected, regardless of whether it is all taxpayers, or various sub-groups of taxpayers. That is, you could take the top 1%, the top 5%, the top 50%, or the top X%, all the way to the top 100% (all taxpayers), and you would probably always find a significant, and possibly similar and consistent pattern of income inequality.

Addendum:
See my article on this topic. For Nobel prizes, the top 20% of countries receiving Nobels have received 85% of all prizes awarded. For Olympic medals, the top 20% of countries receiving medals received 70% of all medals. In most sales environments (real estate, securities, insurance, etc.), it is expected that the top 20% of salespeople generate 80% of all sales. It is probably the case that the top 20% of students at a university receive 80% of all grade points every semester. In the NBA, the top 20% of the players probably generate 80% of the total points scored. For movies, the top 20% of the highest grossing movies probably generate 80% of all revenues. For books, the top 20% best-selling book probably generate 80% of all sales. The list could go on... If this is a natural outcome in any competitive process, the process of earning income should be no different.

If talent, ambition, skills and luck are distributed "unequally," should we not expect unequal outcomes? And suppose you don't like the inevitable result of an inequality of outcome? What is the logical solution to correct such a "problem"? The use of the coercive force of the government to redistribute income, sales revenue, grades, Olympic medals, Nobel prizes, or grade points?

And now think about this scenario: what if professors started "grade redistribution" at the end of each semster, and took grade points away from the A students and gave them to the D students, to achieve a more "equal" distribution of grade points and final grades, possibly resulting in all Cs? Who would study?

What Does a 4BR Home Cost? Depends....

What does it costs to buy a typical four-bedroom home, with 2.5 baths and a double garage? Well, it depends a lot on whether you buy the house in Minot, ND or Beverly Hill, CA. In Minot the 4BR home will cost you $132,333, and the same house in Beverly Hills will cost you a cool $1.8 million. For the complete list of home prices in 342 cities, click here.

Greenspan Calls Sarbanes Oxley a "Nightmare"

From today's Investor's Business Daily, an editorial about Sarbanes-Oxley, specifically about how former Fed chair Greenspan now has second thoughts about a bill he once supported, but now calls a "nightmare."

According to IBD, it's "the arrogance of Washington that gave birth to the Sarbanes-Oxley monster, " which:

• Requires small companies to spend an average $3 million a year and big companies an average $8 million to comply with its rules.

• Is responsible for a $1.5 trillion reduction in value in the U.S. stock market, according to an American Enterprise Institute study.

• Creates conditions so demanding that only one of the top 10 overseas IPOs was held in the U.S. last year.

• Prompted European companies to withdraw from U.S. exchanges because of the heavy financial burden of compliance.


Good Thinking Senators.....

From today's NY Times, an article about how "the Chinese government has sharply stepped up the appreciation of its currency, allowing it to push through an important level against the dollar on Thursday for the first time."

The recent climb of the Yuan (depreciation of the dollar, see graph above) — less than a full percentage point since the beginning of September — is still modest and perhaps will not last. But it is producing cautious hope in the Bush administration that the Chinese government may be lifting its opposition to a revaluation that could ease China’s huge trade surplus with the United States.

And partly in response to the currency lift in China, two influential senators in Washington announced Thursday that they were pulling back legislation that would punish China with 27.5% tariffs if it did not allow the value of its currency to rise, a step that would make exports to the United States more expensive and imports from America more competitive.
Good thinking senators....... because how would 27.5% taxes (tariffs) on Chinese products that would be imposed on, and paid for, by US consumers and US business "punish China?" And wouldn't that be "price gouging?"

Wednesday, September 27, 2006

Business Failures are Good for the Economy

The market imposes strict, severe and fierce discipline, through the profit and loss system, especially by imposing harsh penalities for firms that operate inefficiently. More than 80 percent of new firms in the United States end up failing and about 10 percent of all American companies fold each year. But do these business failures provide real economic benefits and enhance social welfare? Yes, business failures are good for the economy, according to a study by University of Michigan professor Hart Posen.

His study found that the more firms that enter a market, the greater the likelihood that poorly performing established companies will disappear, suggesting that failure is merely a byproduct of a phenomenon (excess entry) that yields superior firms.


In addition, competition from a glut of new companies—even those that eventually fail—leads to innovation and efficiency gains among incumbent firms, they say.

This happens for two reasons. First, excess entry, which leads to decreases in price margins, spurs incumbent firms to innovate and reduce costs over the long term. Second, knowledge produced by failed firms, while wasted on themselves, may be absorbed by survivor firms through a spillover effect.

Competition breeds competence. The market rules.

Medical Tourism

It's easy to see why people are tempted to combine travel with surgery: The cost of medical procedures is often much lower abroad. For example, Howard Staab, a 53-year-old North Carolina contractor, was healthy in the summer of 2004--or so he thought, until his doctor found a life-threatening heart condition during a routine physical.

Uninsured, Staab had always paid out-of-pocket for medical care. But discussions with the local hospital revealed uninsured patients pay much higher fees than insurers do. Staab faced a $200,000 bill for the heart valve surgery he needed if it was performed there.

In September 2004, Staab got his surgery at a state-of-the-art facility in New Delhi, India. He is part of a growing number of people traveling to other countries in search of low-cost medical care. Staab's surgery cost $6,700; post-operative lodging and airfare added another $1,500 to the tab.

PlanetHospital.com is a Web site that connects patients with high-quality medical facilities in India, Thailand, Singapore, Mexico, and Costa Rica.

When potential clients contact PlanetHospital.com, the medical staff reviews their medical history to assess whether they are well enough to travel; some people may have waited too long to seek care and therefore are not healthy enough to make a long flight to India or Thailand.

Staff members then help clients choose appropriate physicians and destinations for care; the medical records are digitized and placed online to allow physicians in the destination country to easily review the patients' medical histories; PlanetHospital.com then arranges conference calls between the physician and patient to discuss the procedure.

Once the patient chooses a physician, arrangements are made for the procedure. PlanetHospital.com assigns a case manager from the destination country; the site often arranges travel and lodging as well.

A country manager coordinates any additional requirements such as cell phone service and airport transportation; case managers attend to all needs that arise while the patient is in the destination country.

Although insurers currently do not make medical travel part of their provider networks, they may in the future, according to Mercer Health & Benefits, a national consultancy group for human resources managers.

Source: Devon Herrick, "
Medical Tourism Prompts Price Discussions," Heartland Institute, October 1, 2006.

Tuesday, September 26, 2006

What's a Degree Worth?

These salary increases indicate that 2005-06 has been the best job market in the past four years.

Business disciplines posted increases across the board. Accounting grads' average offer rose by 6.2 percent to $45,723, and business administration/management graduates saw an increase of 3.9 percent, raising their average offer to $39,850. The average salary offer to economics/finance graduates jumped 11 percent to $45,191.

DJIA Within 53.5 Points of Record-High

The Dow Jones closed today at 11,669.39, the second highest closing in history, and within 53.5 points of the highest close in history on January 14, 2000.

India's Outdated Foreign-Exchange Policy

From today's WSJ: "Rupee Reform"

Despite these achievements, India's whole approach to foreign-exchange control is badly outdated, a point occasionally recognized in the report itself. The system was invented during World War II, strengthened in the late 1950s and made truly draconian in the early 1970s by former Prime Minister Indira Gandhi. It is animated by the view that foreign exchange is the property of the state, and that Indian residents are constantly poised to mount a run against the rupee.

BUS 468: 10-year Yields Falling


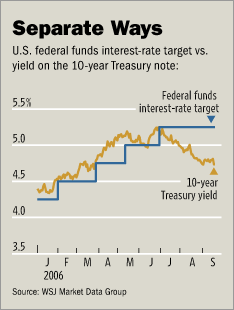
Ten-year T-note yields hit 4.55% yesterday, the lowest level in about 7 months, since February 28 (see graph above).

From today's WSJ front page:

In one of the bigger surprises in financial markets this year, a growing sense that the economy is slowing and inflation receding is fueling a rally in the nation's bond markets, pushing Treasury-bond yields to their lowest levels in months.

Because bonds pay fixed interest, their yields go down as investors bid up their prices, and vice versa. Earlier this year, Treasury yields rose as investors fretted that a strong economy would pump up inflation. Inflation eats away at bond returns, so investors dumped Treasurys, which pushed bond prices lower and their yields higher.

Now, in the upside-down world of bond investing, bad news about the economy has investors turning back to bonds, which is pushing yields back down, essentially making it cheaper to borrow money.


Monday, September 25, 2006

Home Sales Fall in August, Buyer's Market


Total existing-home sales – including single-family, townhomes, condominiums and co-ops – dropped 0.5% to a seasonally adjusted annual rate of 6.30 million units in August, down from 6.33 million homes in July, and were 12.6 percent lower than the 7.21 million-unit level in August 2005.

The national median existing-home price for all housing types was $225,000 in August, down 1.7 percent from August 2005 when the median was $229,000. This was the first year-to-year median price decline since April 1995, and it was the second-biggest year-to-year price decline in the 38-year history of the monthly survey of home sales released by the National Association of Realtors (since 1968).


Mortgage Rates Falling


30-year mortgage rates now at a 6-month low of 5.8%.

Sunday, September 24, 2006

Wal-Mart Goes Global

The number of Wal-Mart stores in foreign countries:

Argentina: 11
Brazil: 295
Canada: 278
Japan: 398
Mexico: 774
Puerto Rico: 54
S. Korea: 16
UK: 315
China: 56
Guatemala, Honduras, El Salvador, Nicaragua and Costa Rica: 363

How does this benefit the U.S. economy? Wal-Mart employs about 1,500 people at its Arkansas headquarters (about 10% of 15,000 total jobs there) just to coordinate worldwide shipments for the 2,560 stores outside the U.S.

$1.90 Gas and Oil Below $60!!

Gas prices keep falling, now down to $1.90 per gallon in Missouri, and oil just went below $60 per barrel for the first time in 6 months!

Economic Appreciation 101

"I think we really need to appreciate what we have in the U.S. economy. That we benefit greatly from openness and competition. Our economy is by far the world's strongest. Because it's built on openness … to people of all nationalities, new ideas, investment, openness to competition, and it's a model that others try to emulate. And if you're sitting here in this country, you don't see it like you do when you're traveling around, and when I traveled around the world and everywhere I went, where people would welcome me, they welcomed me because they wanted to know about economic best practices. They wanted to know how we did things in the U.S., often, and how it would be applicable to particularly the developing world. And so we need to cherish what we have, we need to strive to keep it this way, and I think it's our proven record of success that lets us advocate free trade, open markets, here in the United States and around the world."

~Treasury Secretary Henry Paulson

International Gas Prices

Current gasoline prices, in USD per gallon:

Belgium

France

Germany

Italy

Netherlands

UK

$6.13

$5.71

$6.02

$6.02

$6.57

$6.40


To Tow or Not to Tow?


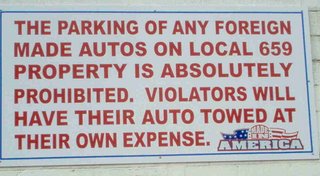
The sign above is posted in the parking lot of the UAW Local #659 in Flint, Michigan, and I just took this picture today. I noticed a Honda in the parking lot while I was taking photos, so I am not sure how strictly this parking ban is enforced.

Just wondering..... how do you think the local union would classify these vehicles?

Buick Lacrosse, Chevy Equinox, Chevy Impala, Chevy Monte Carlo, Chevy Silverado, Chrysler 300, Chrysler Pacifica, Chrysler Town and Country, Dodge Caravan, Dodge Charger, Dodge Magnum, Ford Crown Victoria, Ford Freestar, GMC Sierra, Mercury Grand Marquis, Dodge Stratus, and Pontiac Torrent. Problem? All of these vehicles are made by the UAW, but in Canada. Isn't that a foreign country? Wouldn't those be "foreign made autos"?

Another problem is that the Chevy Silverado and GMC Sierra are also produced in the U.S., directly across the street from UAW Local #659 in Flint at the Flint Truck Plant. Better check those VINs before towing - 1A is US and 2A is Canada. Same for the Chrysler Town and Country and the Dodge Caravan, they are produced both in the U.S. and Canada, so check those VINs before towing those models.

Now, what about these vehicles?

Mitsubishi Eclipse, Mitsubishi Galant, Mazda 6, Toyota Corolla, Mazda Tribute, Mitsubishi Endeavor, Mazda B Series Truck, Mitsubishi Raider, Toyota Tacoma, Isuzu I-Series Trucks?

The problem? All of these vehicles are produced in the U.S. BY THE UAW!? Hmmmmmmm. Guess they can't be towed. But don't they sound pretty "foreign"?

And what about the Cadillac Catera, now discontinued and replaced by the STS and CTS? The problem? It was built in Germany. Tow or no tow?

And to further complicate matters, what about Volvos, Jaguars and Saabs? Volvo and Jagaur are owned by Ford and Saab is owned by GM?

To tow or not to tow? It gets soooooo complicated in the Global Economy.

BUS 466: Undervalued Yuan and Yen?

A recent WSJ article reported that during the annual meeting of the International Monetary Fund (IMF) in Singapore last weekend, finance ministers from the Group of Seven (G-7) major industrial powers (United States, Japan, Canada, France, Italy, Germany, and the United Kingdom) urged China and Japan to appreciate their currencies. The United States and European countries have become worried that their companies are being placed at a disadvantageous position by cheap Asian competitors as a result of undervalued Asian currencies, namely, the Chinese yuan and Japanese yen.

U.S. politicians, unions and manufacturers argue that China has deliberately kept the yuan undervalued against the dollar costing American companies sales and American workers jobs. Treasury Secretary Henry Paulson thinks that the yuan issue has to be addressed to resist protectionist measures under consideration in Congress. As a punitive measure, the U.S. Senate is expected to vote this month on a bill that would impose 27.5% tariffs on Chinese imports.


In a related WSJ article, China's central bank governor says China will allow market forces to play a greater role in setting the value of the yuan and will adjust the currency's daily trading band "sooner or later."

We will discuss these issues in class on Tuesday.

Saturday, September 23, 2006

Economic Freedom of the World

Q1: Which are the five most economically free countries in the world?

In order, the most economically free countries are: Hong Kong (#1), Singapore (#2), and the U.S., New Zealand, and Switzerland (tied for #3).

Q2: Which are the five least economically free countries in the world (Note: Cuba and North Korea were not considered because data were not available)? In order, least economically free countries are: Zimbabwe, Myanmar, Congo (Republic), Congo (Democratic Republic), and Venezuela.

See the
Economic Freedom of the World: 2006 Annual Report, just released by the Cato Institute. Professor James Gwartney is the main author and researcher for the annual report, and he is also the author of the economics textbook I use for my classes.

Each country's economic freedom is measured on an index scale from 1 (economically least free) to 10 (economically most free) based on economic freedom in five areas (size of government, property rights, sound money, free trade, and regulation). Then those quantitative measures of economic freedom can be used to see how economic freedom correlates with economic variables, health measures, political freedom, income inequality, etc.

As you might expect, the overall standard of living is significantly higher in countries with economic freedom compared to countries with low levels of economic freedom: per-capita GDP is much higher in economically free countries, economic growth rates are higher, unemployment rates are lower, life expectancy is longer, fewer children are in the labor force, and political rights are stronger.

Freedom works.

Would You Trade Today's Gas Prices for Yesteryear?

Feeling nostalgic about the "good old days of 'cheap' gas prices?" Below are the average retail prices for gasoline in the U.S. during previous decades, according to the U.S. Energy Information Administration:

1920s: 23 cents/gallon
1930s: 19 cents/gallon
1940s: 22 cents/gallon
1950s: 29 cents/gallon
1960s: 32 cents/gallon
1970s: 54 cents/gallon
1980s: $1.11/gallon

Would you be willing trade today's "high" gas prices, now about $1.97 in some Michigan areas according to
GasBuddy.com, for yesteryear's "cheap" gas prices above? If so, you are suffering from "money illusion," the confusion between real, inflation-adjusted prices, and nominal, current, or unadjusted prices! Here are historical retail gas prices in TODAY'S dollars:

1920s: $2.68 /gallon
1930s: $2.69 /gallon
1940s: $2.36/ gallon
1950s: $2.17 / gallon
1960s: $2.01 /gallon
1970s: $2.02/gallon
1980s: $2.21/gallon

Gas prices today are 25% below the 1920s price, adjusted for inflation!

So far, the historical record for average, monthly retail gas prices was set in March 1981, when the price for gasoline averaged $3.12 per gallon. In fact, there were 10 months in 1980 and 1981 when retail gas prices were above $3/gallon. There has never been a single month since then when real gas prices have averaged more than $3/gallon. The highest monthly average price in recent years was $2.87 per gallon last September 2005, after the hurricanes wiped out most of the oil production in the Gulf Coast area.

And here is maybe the best news of all: The Energy Information Administration expects retail gasoline price to fall by another 25 cents by the end of the year! Carpe Diem!

PPI Report

The Department of Labor reported on Tuesday that the Producer Price Index for finished goods, which tracks inflation at the wholesale level, rose a modest 0.1% in August. This was the second consecutive month that price pressures eased for finished goods, primarily due to slower growth in prices of energy products. Excluding the food and energy categories, producer prices fell 0.4%, following a 0.3% decline in July. Compared with a year ago, the overall PPI was up 3.7%, which was the slowest growth rate since March. Prices of "core" intermediate goods considered a leading indicator of consumer inflation rose 0.4%, which was also the slowest growth rate since March.

"Tax Hike" for the Rich

The Joint Economic Committee (JEC) of Congress just released its annual report on the share of total personal income taxes paid in 2004 (most recent year available) by different income groups (percentiles) on Friday. The report is titled "Top Half of Taxpayers Pay Highest Tax Share in Decades."

The share of income taxes paid by the top 50% of taxpayers reached its highest level in decades - the top 50% paid 96.70% of the individual income taxes paid in 2004, compared to 86.05% in 1949, 89.35% in 1959, 90.27% in 1969, and 96.54% in 2003. The share of income taxes paid by the bottom 50% declined from 3.46% in 2003 to 3.30% in 2004. (In 1949 the income tax burden of the bottom half was 13.95%!)

The top 1% paid 36.89% of 2004 income taxes, compared to 34.27% in 2003, 33.71% in 2002 and 33.89% in 2001.

According to JEC Chairman Jim Saxton:

The new IRS data confirm once again that the tax burden is disproportionately borne by taxpayers in the top half. These tax data should be at the center of any future debate about tax policy. Unfortunately, a lot of discussion of tax policy is conducted without any reference to the shares of taxes actually paid by various income groups. As I have stressed for many years, the tax shares already paid by various income groups largely determine the distributional outcomes of most major tax changes, not the tax rate structure of the legislation itself.

Income Percentiles

Income Thresholds

Percentage of Personal Income Tax Paid

Top 1%

$328,049

36.89%

Top 5%

$137,056

57.13%

Top 10%

$99,112

68.19%

Top 25%

$60,042

84.86%

Top 50%

$30,122

96.70%

Bottom 50%

< $30,122

3.30%

Source: IRS (Tax Year 2004)

I think if you asked the general public two questions:

1. Is a household with two income earners that reported an annual household income of $99,000 in 2004 part of the group that you would describe as "the rich"?

2. Would you consider the top 10% of American households (by income) part of the group you would describe as "the rich."

I suspect that most people would answer NO to the first question (they would think of that household income as "middle class") and YES to the second question, even though those two groups are exactly the same households!

Note that in 2004, the average weekly manufacturing wage in Flint, Michigan was about $1400 per week, or about $70,000 per year. Therefore, even the average manufacturing worker would be in the top "richest" 20% (approximately), some would likely be in the top 10%.


Tax Revenues at All-Time High

FEDERAL TAX RECEIPTS THROUGH AUGUST
(Billions of Dollars)


Source

Actual FY 2005

Preliminary FY 2006

Percent Change

Individual

$830

$932

12.3%

Corporate

$208

$268

28.8%

Social Insurance

$727

$789

5.8%

Other

$137

$154

12.5%

TOTAL

$1902

$2123

11.6%


Sources:
Department of the Treasury; CBO

Tax revenues collected in 2005 were the highest in history, $2.15 trillion, a 14.5% increase from 2004. With one year left in the federal government's fiscal year, tax collections through August in 2006 have already surpassed last year's revenues, and therefore tax revenues in 2006 will set another record of about $2.4 trillion, about a 12% increase from last year. As a percent of GDP, tax revenues this year will be 18.3%, the highest in 6 years (since 2000).

In other words "the tax cuts" of 2003 have actually turned out to be significant tax increases, measured in revenues. Further, the "rich" now pay a higher share of all taxes paid. Look for an upcoming post on that topic.

Quote of the Day

“The construction of an economic model, or of any model or theory for that matter (or the writing of a novel, a short story, or a play) consists of snatching from the enormous and complex mass of facts called reality, a few simple, easily-managed key points which, when put together in some cunning way, become for certain purposes a substitute for reality itself.”

---Evsey Domar, Essays in the Theory of Economic Growth


Friday, September 22, 2006

Dow Jones Industrial Average hits the 4th-highest closing level in history on Wednesday (11,613), but closes down by 52.67 points for the week at 11,508.

U-Haul Rates Reflect Relative Demand

Here are the U-Haul rates for a one-way truck rental on a 26-ft truck in October 2006, from U-Haul's website for one-way rental quotes:

Flint to Nashville: $1730
Nashville to Flint: $433

Flint to Jacksonville: $1884
Jacksonville to Flint: $432

Flint to Altanta: $2312
Altanta to Flint: $272

Same equipment, same distance, but it is 8.5X more expensive to move OUT of Flint compared to moving TO Flint!! Can you predict which direction people are moving based on these market prices for one-way truck rentals?

Like airlines price tickets, U-Haul prices one-way rentals dynamically, based on relative demand at any given point in time. Ceteris paribus, if it is 8.5X more expensive to rent a truck from Altanta-Flint than Flint-Atlanta, it is precisely because there are 8.5X more households wanting to go from Flint-Atlanta than Atlanta-Flint.

I believe there is great empirical research potential here with these one-way rental data, especially if these data could be tracked over time. We can pontificate endlessly about relative tax burdens among states, differences in business climates, right-to-work issues, labor costs, union vs. non-union, desirability of differnent locations for living or doing business, etc., etc., but the U-Haul one-way rental prices reflect actual, REAL demand, based on what people are ACTUALLY doing, in terms of where they are ACTUALLY moving. Talk is cheap.... One-way rental prices are a direct measure of relative attractiveness.

For example, it would be interesting to investigate the one-way rental differentials between high unemployment states (Michgian) and low unemployment states, states with high tax burdens (Michigan) and states with low tax burdens, heavily unionized states and right-to-work states, etc. It would also be interesting to track these one-way rental data over time....


Interesting Fact of the Day

The United States, with a smaller population (295 million vs. 725 million), has created more private sector jobs in just the last four years than all of Europe has in the last 20 years!

Income Inequality: The Outlier Effect

UC-Berkeley economist Hal Varian (formerly at UM) writes in the NY Times yesterday about income inequality, a topic that has received a lot of attention lately.

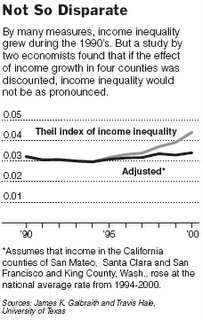
The implication is that the income gains of the 1990’s associated with the technology bubble not only accrued to a relatively small number of people but also occurred in a relatively small number of geographic areas.

To drive this point home, the authors asked what would have happened to the index if just 4 of the 3,100 counties in the United States exhibited average income growth in the technology boom years. The four are Santa Clara, San Mateo, San Francisco (all associated with Silicon Valley) and King County, Wash. (home of Microsoft).

Note the remarkable difference in the Theil index (see graph above) computed with the adjusted growth rates for these four counties: If the per capita income in just these four counties had grown at the same rate as the average in the United States, income inequality across counties would have changed little in the late 1990’s. In other words, only four counties drove most of the change across the 3,100 counties.

Conclusions: a) Outliers matters and b) income inequality hasn't changed much.

Michigan and Mississippi?

What do Michigan and Mississippi have in common? Both have August unemployment rates of 7.1%, the highest state jobless rates in the country. States with the lowest unemployment rates in August are Hawaii (2.8%), SD (3.2%), Utah (3.2%) and VA (3.2%).

TEN states have set
historical record low unemployment rates so far this year in 2006:
Alabama (3.3% in March)
Arizona (3.6% in August)
Florida (3.0% in June)
Idaho (3.2% in March)
Louisiana (2.9% in July)
Montana (3.4% in March)
Nevada (3.6% in January)
New Mexico (4.0% in March)
Washington (4.6% in March)
West Virginia (3.8% in January)

I wrote about this in a
newspaper commentary distributed nationally a few months ago, when there were nine states with record low jobless rates, now Arizona makes the 10th state with its record low rate in August.
Even in its worst recession, the U.S. economy is still stronger than almost any other country in the world during their best years. And yet even now when the U.S. economy has a historically high level of employment, historically low unemployment rates in nine states, and higher national income, output and tax revenues than at any time in U.S. history, the Dangerfield economy still gets no respect.

Thursday, September 21, 2006

Gotta Love Wal-Mart

Wal-Mart announced today that it will start a test program in Florida, where it will sell generic prescription drugs for $4 for a 30-day supply. The test will start tomorrow in 65 Tampa Bay-area stores and is to expand to the whole state by January.

In a statement, CEO Lee Scott says the world's largest retailer intends to "take the program to as many states as possible next year."

On average, generic drugs tend to cost between $10 and $30 for a month-long supply.

Imagine a world without Wal-Mart. Consider the world today WITH Wal-Mart. I like the world WITH Wal-Mart much better than a world without it. According to columnist John Tierney of the NYTimes, "Wal-Mart has been one of the most successful antipoverty programs in America." Amen

Watch the incredible expansion of Wal-Mart across the US.


Musical Talent Deserving of Wider Recognition

Shirley Brown, awesome soul, blues and R&B singer, with a voice like Aretha Franklin, maybe even better. Recommended Shirley Brown CD is Timeless, I have been listening to this for the last week, and especially like the song "Still in Love." Check it out...

The only radio station I know about to hear music like this is
KFAI Fresh Air Radio in Minneapolis-St. Paul, check it out - you can listen online, either live or by accessing two weeks of archives. My favorites are the blues shows from 3 - 6 p. m. daily (Central time), M-F.

Gas Price Conspiracy? Not Likely, It's the Market at Work

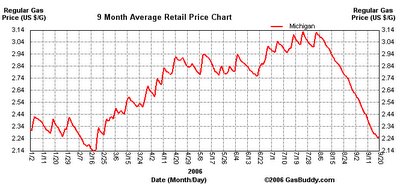
With gas prices falling at the pump and crude oil trading at a six-month low (see chart above for Michigan gas prices), many have begun raising the specter of "conspiracy," claiming the trend is spurred by the coming election, says H. Sterling Burnett, a senior fellow with the National Center for Policy Analysis.

However, in reality, nothing could be further than the truth. "This is basic economics," says Burnett. "Markets, when not encumbered by foolish legislation to 'fix' a problem, work."

Keep in mind that all of economic science can be summarized by this equation: P = D / S, and therefore the ONLY reason for prices to fall is for Demand to decrease, or Supply to increase, or both. Period. For oil and gas, both of those factors explain the drop in prices over the last 6 months.

According to
GasBuddy, gas prices in some parts of Michigan are now below $2 per gallon.

The reason for the recent price drop can be attributed to several economic factors:
o Previously high prices are bringing more oil to market, increasing supply.

o Drilling rigs and production are up, refineries are being expanded in the US and built in other countries for the first time in years, and new technologies are being applied to exploit traditional and non-traditional sources.

o In response to high prices, consumers are conserving, decreasing demand for gas; for example, sales of SUVs have fallen but increased for fuel efficient cars.

o Also, the bursting of the speculative "risk bubble," as the Middle East has calmed.
More Iraqi oil is reaching the market, Iran seems unlikely to face sanctions and Israel has left Lebanon. In addition, the hurricane season has been more mild than predicted. This means inventories, which were built up as a hedge against future shortages, are high.

"Oil may never be $15 or $20 a barrel again," said Burnett. "But absent a significant political crisis, such as OPEC reducing supply, they will continue to fall."

Outsourcing Has Been Very, Very Good for Him and India

From the NY Times ("Outsourcing: It's Been Good to Him"), an interview with Azim Premji, the CEO of India's outsourcing giant and IT powerhouse Wipro, and India's richest man.

But what is not getting adequate focus is that globalization is a two-way street. If the United States wants access to Chinese, Indian or Vietnamese markets, we must get access to theirs. U.S. protectionism is very subtle but it is very much there.

The important thing about outsourcing or global sourcing is that it becomes a very powerful tool to leverage talent, improve productivity and reduce work cycles. The West is not producing enough engineers. The United States will produce 75,000 engineers this year; they will produce more sports therapists than engineers. Germany, the great engineering power of Europe, will produce 35,000 engineers this year; they will produce more architects than engineers. Western companies want access to Indian talent, that is why they outsource, that is why they come to India to set up base.


Interesting Fact of the Day

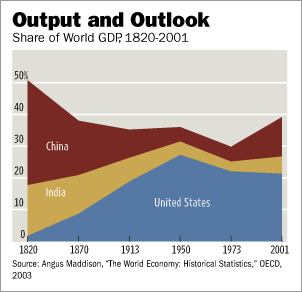
In 1820, US had only about 2% of world GDP and China and India together had about 50% of world GDP! By 1950, the US had about 25% of world output and China and India together had about only 10% of world output. Now India and China are both growing faster than the U.S. Conclusion: Markets work!

HP Introduces the "Slimming Camera"


Check it out at Marginal Revolution

Expected Inflation Coming Down?

Fed holds steady on interest rates yesterday, inflationary expectations coming down?

Wednesday, September 20, 2006

George Will on Wal-Mart, 100 Applicants Per Job

George Will writes on Wal-Mart:

The median household income of Wal-Mart shoppers is under $40,000. Wal-Mart, the most prodigious job-creator in the history of the private sector in this galaxy, has almost as many employees (1.3 million) as the U.S. military has uniformed personnel. A McKinsey company study concluded that Wal-Mart accounted for 13 percent of the nation's productivity gains in the second half of the 1990s, which probably made Wal-Mart about as important as the Federal Reserve in holding down inflation.

Wal-Mart and its effects save shoppers more than $200 billion a year, dwarfing such government programs as food stamps ($28.6 billion) and the earned-income tax credit ($34.6 billion).

People who buy their groceries from Wal-Mart — it has one-fifth of the nation's grocery business — save at least 17 percent. But because unions are strong in many grocery stores trying to compete with Wal-Mart, unions are yanking on the Democratic Party's leash, demanding laws to force Wal-Mart to pay wages and benefits higher than those that already are high enough to attract 77 times as many applicants than there were jobs at this store.
The amount of criticism and bad press Wal-Mart continually receives seems way out of line to me, considering the significant benefits it creates for the U.S. economy. And is it really any different at McDonald's, Home Depot, Target, all of the Dollar Stores, K-Mart, Big Lots, Pizza Hut, Burger King, Wendy's, etc. as far as wages and benefits? I don't think so. In fact, if Wal-Mart gets 25,000 applications for only 325 openings at a single store, isn't that evidence that Wal-Mart wages are actually too HIGH?

And as much criticism as Wal-Mart gets for "driving small downtown merchants out of business," why doesn't Home Depot get the same criticism for driving small family-owned hardware stores out of business? Why don't Borders and Barnes & Noble get criticism for driving small book stores out of business? Perhaps being the #1 retailer in the world, Wal-Mart becomes the punching bag for all of the retailers?

Are Living Standards Improving or Not?

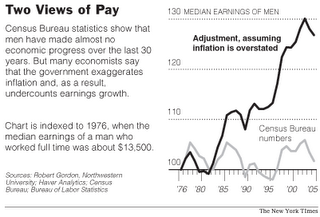
Today's NY Times has a good article in today's (9/20/06) Business Section about living standards, and whether they have been increasing or decreasing over time. One important economic issue is the fact that official consumer price data overstate the actual cost of living, which then understates in the increases in real income (see graph above). One reason for the overstatement pointed out in the article is that new products don't get added to the official basket of 364 items of goods and services until much of the significant price decreases have occurred.

"But the experts keep fighting over living standards, largely because the single most commonly used measure of well-being — how much money people make — can be very misleading. This is where inflation, the second big issue, comes in.

In the early 1950’s, Toro began selling mass-market snow blowers, which weighed up to 500 pounds and cost at least $150. As far as the Bureau of the Labor Statistics was concerned, however, snow blowers did not exist until 1978. That was the year when the machines began to be counted in the Consumer Price Index, the source of the official inflation rate. By then, the cheapest model sold for about $100.

In practical terms, this was an enormous price decline compared with the 1950’s, because incomes had risen enormously over this period. Yet the price index completely missed it and, by doing so, overstated inflation. It counted the rising cost of cars and groceries but not the falling cost of snow blowers.

The cellphone and the air-conditioner also improved middle-class life, and also took years to get into the inflation numbers, by which point their prices had plummeted. Wal-Mart’s effect on prices is another blind spot in the index, which considers something sold at a discount to be lower quality (and, therefore, not truly a bargain) than something sold at full price — even when the items are identical, like a box of Tide or a can of Campbell’s Soup."


Does College Pedigree Matter? Apparently Not

From Monday's WSJ, interesting article titled "Any College Will Do," about the lack of Ivy League degrees among top CEOs in the U.S.:
"Getting to the corner office has more to do with leadership talent and a drive for success than it does with having an undergraduate degree from a prestigious university. Most CEOs of the biggest corporations didn't attend Ivy League or other highly selective colleges. They went to state universities, big and small, or to less-known private colleges.

"I don't care where someone went to school, and that never caused me to hire anyone or buy a business," says Warren Buffett, CEO of Berkshire Hathaway, who graduated from the University of Nebraska-Lincoln."